
Month: October 2026
Blog

CDN PoPs Explained: Do More Locations Always Mean Better Performance?
A CDN map makes comparison look simple: count the locations, compare the countries, and choose the largest footprint.
That approach can produce the wrong infrastructure decision.
A content delivery network point of presence only creates value when it improves delivery to actual users. Geographic proximity does not guarantee efficient routing, sufficient capacity, or fast content delivery. The IETF’s RFC 4786 explains that topological proximity does not necessarily translate into lower latency.
The buying question isn’t simply how many CDN locations exist. It’s how much of your actual audience can those locations serve within your performance targets?
CDN Coverage– Premium and Volume plans – Real-time traffic analytics – Raw delivery logs |
 |
Why Is CDN PoP Count Insufficient for Predicting Real User Performance?
CDN PoP count cannot reliably predict performance because routing policies, interconnection, and available capacity determine how users reach edge infrastructure. A nearby PoP may deliver worse latency than a distant, better-connected location. Buyers should compare the share of actual audience demand meeting application performance targets, rather than treating geographic coverage as proof of delivery quality.
A CDN PoP Is a Network Path
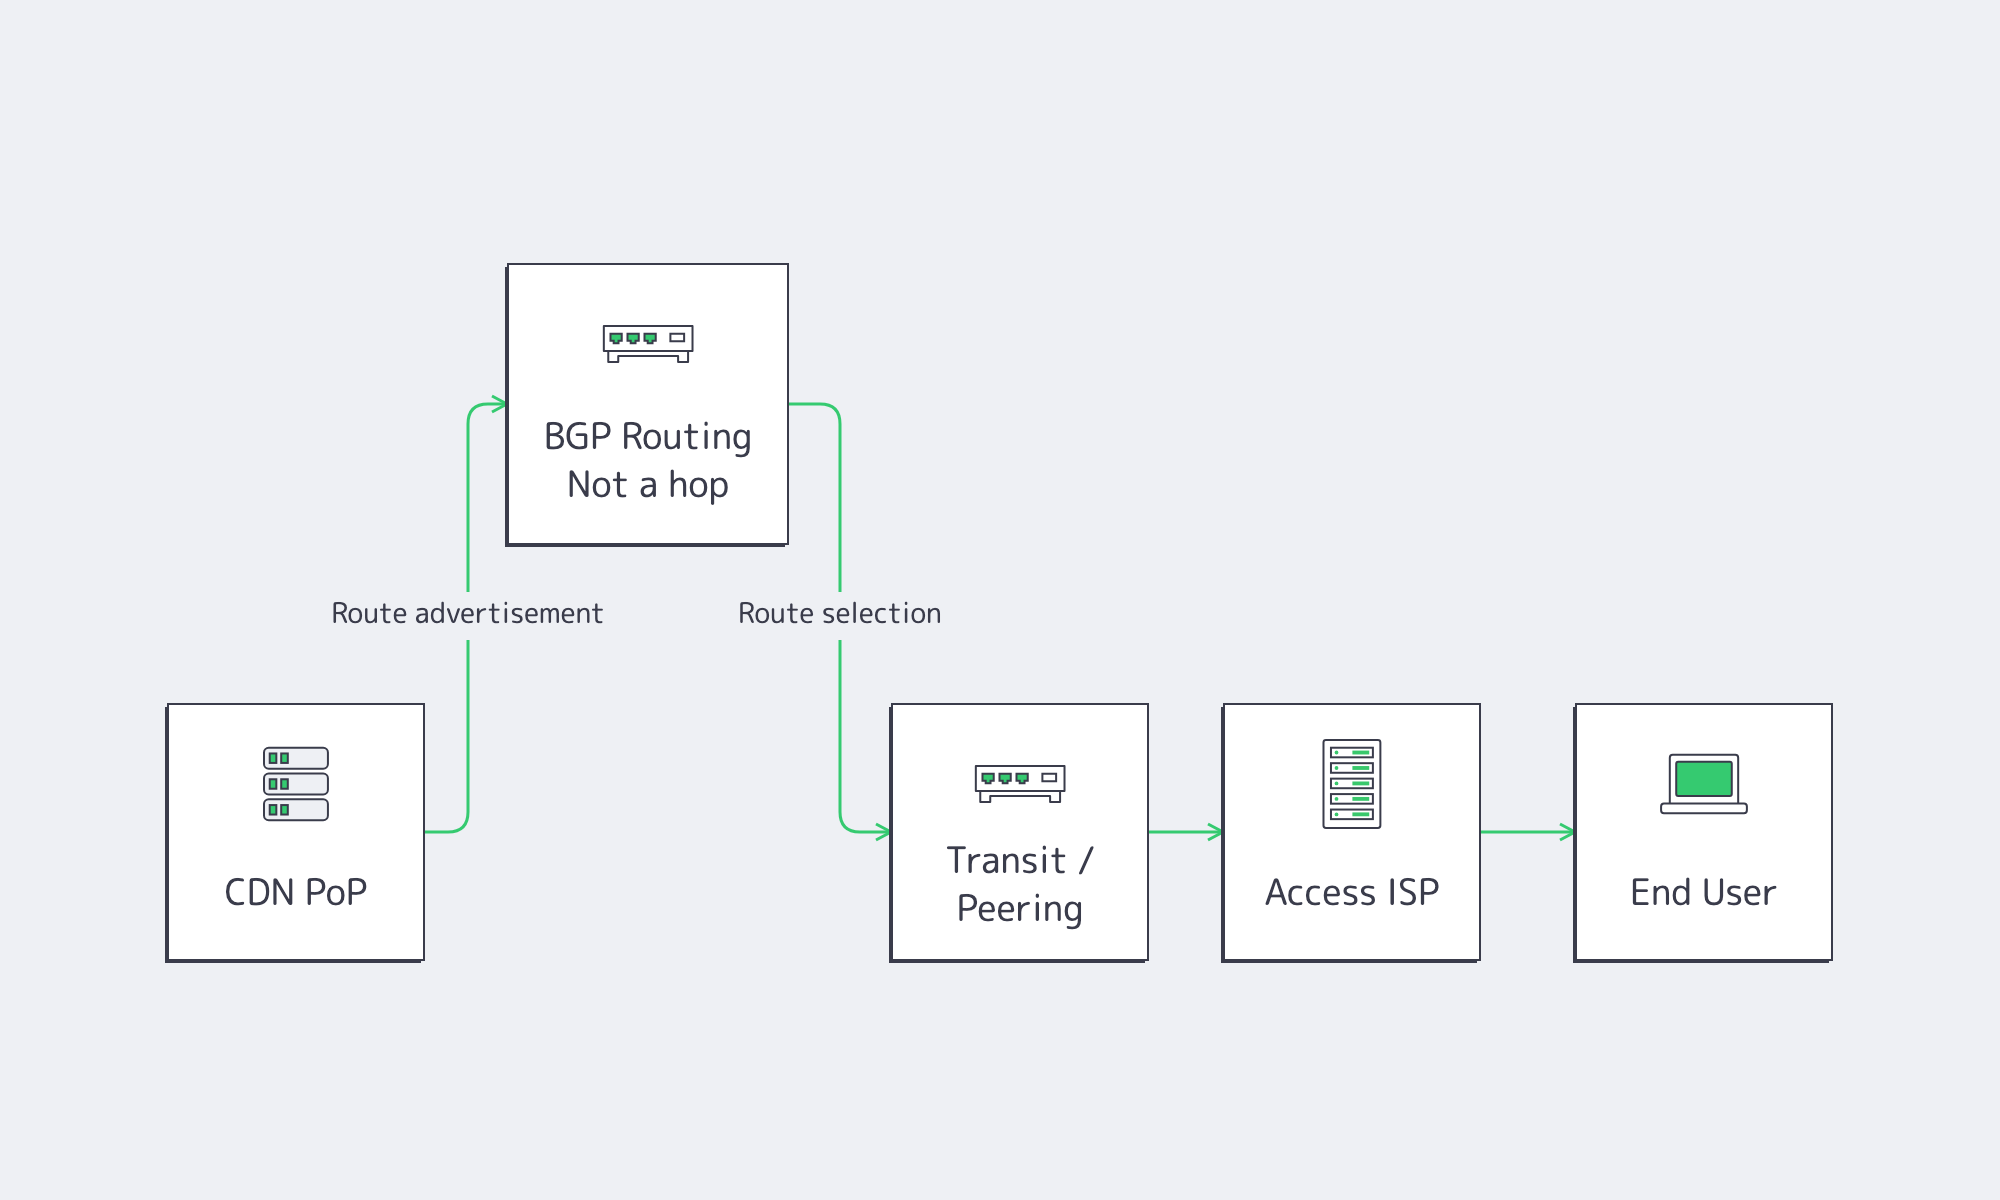
With IP anycast, multiple locations advertise the same service address. Border Gateway Protocol (BGP) determines which route traffic follows based on network topology and routing policies.
The resulting user population assigned to a PoP is called its catchment. As RFC 4786 describes, catchments are neither static nor reliably deterministic.
Consider a digital service concentrated in North America, Western Europe, India, and Brazil. Additional PoPs in markets generating little traffic may contribute less to overall performance than one better-connected PoP serving a major customer network.
The relevant delivery path is:
CDN location → routing advertisement → transit/peering path → access network → user
Not simply:
CDN location → user
Country-level coverage cannot capture the complexity of these connections. A CDN PoP’s physical location matters, but so do the networks exchanging traffic with it and the routing decisions determining which users reach it.
Which Audience Locations and Networks Matter for CDN Coverage?
The most valuable CDN locations serve countries, metropolitan areas, and autonomous systems responsible for meaningful application demand. Begin with the networks carrying the largest shares of traffic, then include smaller segments supporting important customers or latency-sensitive transactions. Evaluate actual serving PoPs and network paths rather than assuming that a location in the same country provides effective coverage.
Match CDN Locations to Audience Demand
Start with production traffic rather than the provider’s coverage map.
Choose a historical traffic window that captures normal operating patterns, local peak periods, and relevant events such as product launches or promotions. Segment demand by country, metro where available, autonomous system number (ASN), requests, transferred bytes, peak bandwidth, and workload.
ASN-level analysis matters because users in the same city can experience different routes through separate broadband or mobile networks.
RIPE Atlas supports measurements selected by country, IP prefix, and ASN. This makes it useful for testing representative access networks instead of relying exclusively on geographically distributed probes.
Build a demand model using:
Segment weight = segment demand / total demand
Choose bytes for bandwidth-intensive applications, requests for APIs, or sessions and transactions where those better represent business impact.
Rank segments by their contribution to demand. Prioritize the largest contributors, then include smaller networks where poor performance would materially affect customers or critical transactions.
Next, map each segment to the PoP actually serving it.
Nominal coverage means a CDN operates in a market. Effective coverage means representative users reach a location that meets application performance targets.
Interconnection Shapes CDN Coverage
Internet exchange points (IXPs) enable networks to exchange traffic, potentially avoiding inefficient transit paths. But IXP participation does not guarantee optimal routing.
A 2020 CDN routing study demonstrated the practical impact of routing policy: after a peering-policy change, median latency in affected regions fell from 40 ms to 16 ms.
These findings make provider-level evidence essential.
| Ask the CDN Provider | Evidence Worth Requesting | What It Establishes |
|---|---|---|
| Which PoPs serve our largest ASNs? | Catchment data, traceroutes | Effective audience coverage |
| How do PoPs reach our access networks? | Peering, IXP, transit information | Path efficiency |
| Is interconnection local or remote? | Routing details | Hidden transport distance |
| Can individual PoPs be tested? | Test IPs, headers, logs | Independent verification |
| What happens during route withdrawal? | Failover tests | Backup-path performance |
| What regional capacity is available? | PoP capacity, peak tests | Sustained delivery capability |
| Is delivery telemetry accessible? | Logs, cache status, analytics | Production visibility |
| How is regional traffic priced? | Zone and volume pricing | Coverage economics |
How Should CDN Capacity Be Validated Against Audience Demand?
CDN capacity validation requires representative traffic during the periods when the application experiences its greatest demand. Test important audience networks for latency distributions, time to first byte, packet loss, cache behavior, and sustained throughput. Define workload-specific performance targets, then calculate the share of demand meeting those targets while verifying sufficient capacity for expected peaks.
CDN PoP Testing Should Measure Tail Latency, Cache Behavior, and Throughput
Low ping alone does not establish that a PoP can sustain peak-demand throughput.
Separate testing into four layers:
Network reachability: Measure RTT, packet loss, and traceroute from representative networks using tools such as RIPE Atlas.
Connection establishment: Measure DNS, TCP or QUIC, and TLS timings, distinguishing cold connections from reused connections.
Response latency: Use the W3C’s Navigation Timing metrics to examine request initiation, first-byte response, and transfer completion.
Delivery throughput: Test realistic object sizes, concurrency, and sustained transfer rates. RFC 9097 defines controlled methods for measuring one-way IP capacity; RFC 9946 adds a standardized UDP capacity-testing protocol.
For meaningful comparisons, hold workload, object size, protocol, connection state, cache status, access network, and measurement window consistent.
Measure p50, p95, and p99 results separately. Median performance describes typical delivery, while higher percentiles reveal slower experiences that averages can conceal.
Validate Capacity Against Peak Demand
Global backbone capacity is not equivalent to available capacity at an individual PoP.
Evaluate regional egress, access-network interconnection, CDN-specific resources, and traffic concentration.
A publisher transferring 600 TB monthly may need modest average bandwidth but far more throughput during a six-hour software release.
Estimate:
Required regional capacity = forecast peak Gbps × safety factor
The safety factor should account for observed peak variability, expected traffic growth, simultaneous events, and the additional load remaining locations may need to absorb during a failure.
Select the factor by modeling these conditions against the forecast peak. Required regional capacity is the resulting total; headroom is the difference between that capacity and the forecast peak.
Cache performance also changes the equation. Warm cache hits avoid origin round trips; misses introduce edge-to-origin latency and additional transfer requirements.
Test both cache states, especially when applications mix static content with dynamic APIs. Distinguish CDN delivery performance from origin processing time.
For each important audience segment, record the serving PoP, RTT, loss, cold and warm connection times, cache-hit and cache-miss TTFB, throughput, errors, and percentiles.
Calculate Demand-Weighted SLO Coverage
Turn measurement results into a comparison metric:
weightᵢ = segment demand / total demand
passᵢ = 1 if the segment meets its SLO;
otherwise 0
Demand-weighted coverage = Σ(weightᵢ × passᵢ)
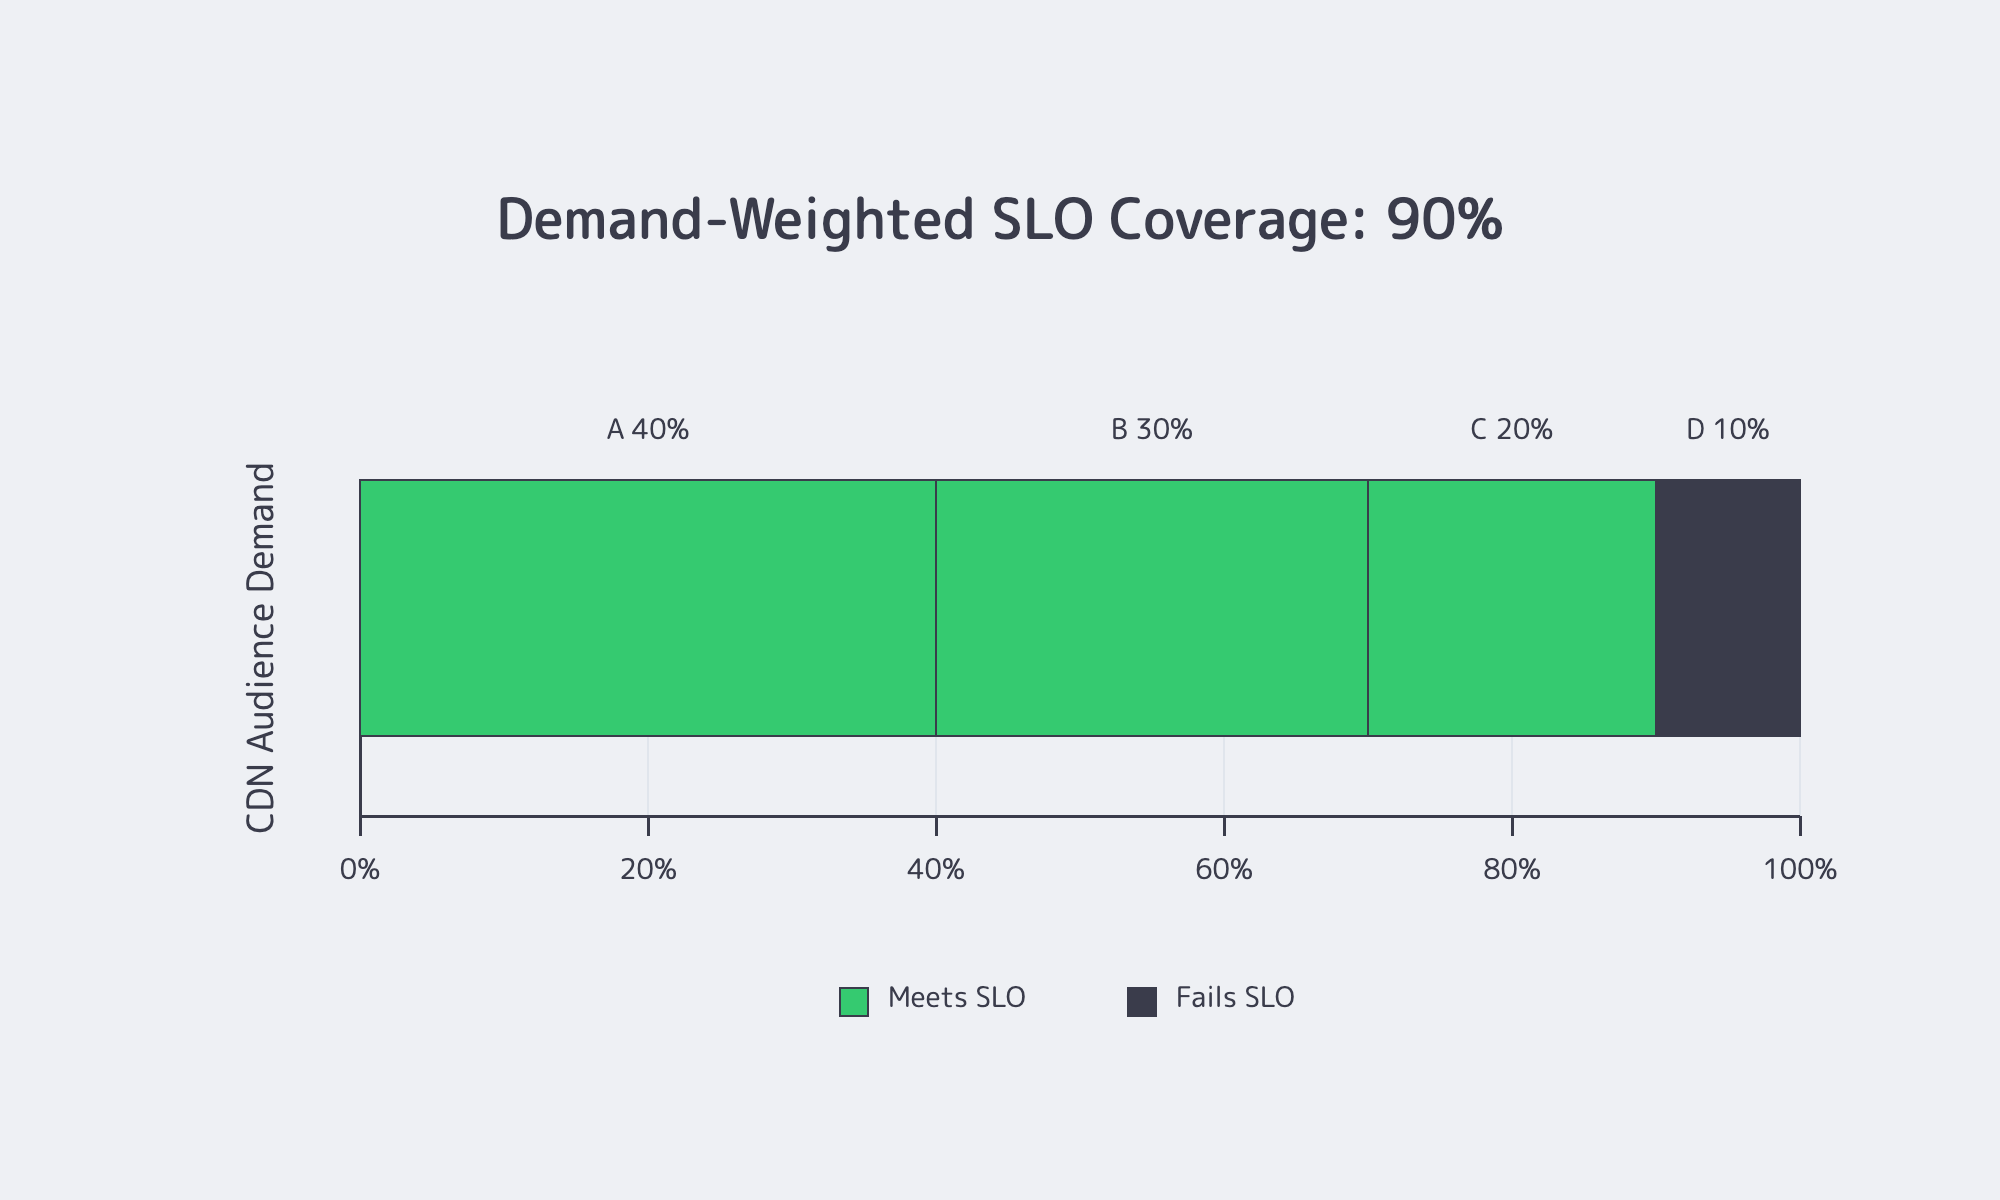
Suppose four segments represent 40%, 30%, 20%, and 10% of traffic. If the first three meet their performance targets and the fourth fails, effective demand-weighted coverage is 90%.
That result is more actionable than claiming coverage in four countries.
Define the pass condition using metrics relevant to the workload. An API may prioritize p95 response latency, while software distribution may require both acceptable TTFB and sustained transfer throughput.
Combine repeatable synthetic measurements with real-user monitoring and CDN logs. Include normal traffic, local peak periods, and representative spikes. Continue testing until the results capture the operating conditions relevant to the purchasing decision.
Melbicom CDN provides real-time analytics and raw logs that engineering teams can use to examine delivery behavior alongside synthetic and real-user measurements.
Choose a CDN Network by Measured Demand, Not Map Density
CDN selection should be an exercise in audience alignment, routing analysis, and capacity planning—not location counting.

A strong evaluation combines production traffic distribution, serving-PoP identification, interconnection evidence, peak-load testing, and demand-weighted SLO results. Repeat the assessment as audience geography changes.
The essential principles are:
- Count effective catchments, not map pins. Give coverage credit only when representative users reach an edge that meets their performance targets.
- Weight coverage by demand. Prioritize high-volume ASNs while separately protecting smaller, business-critical segments.
- Inspect interconnection. Request route-level evidence rather than assuming IXP presence guarantees efficient paths.
- Validate regional capacity. Test peak throughput and headroom, not just aggregate network capacity.
- Measure tail performance. Compare p95 and p99 latency, TTFB, throughput, and errors under equivalent conditions.
- Demand reproducible evidence. Combine synthetic testing, real-user telemetry, and delivery logs before making a purchasing decision.
A CDN network‘s value ultimately depends on how well its locations, interconnections, and available capacity match real audience demand. The most useful footprint is not necessarily the largest; it is the one that consistently delivers the required performance where the application needs it.
Match CDN Coverage to Your Audience
Compare Melbicom Premium and Volume CDN plans against your audience geography and delivery needs. Use real-time analytics and raw logs to assess delivery behavior.
Get expert support with your services
Blog

CDN and Core Web Vitals: What It Can and Cannot Improve
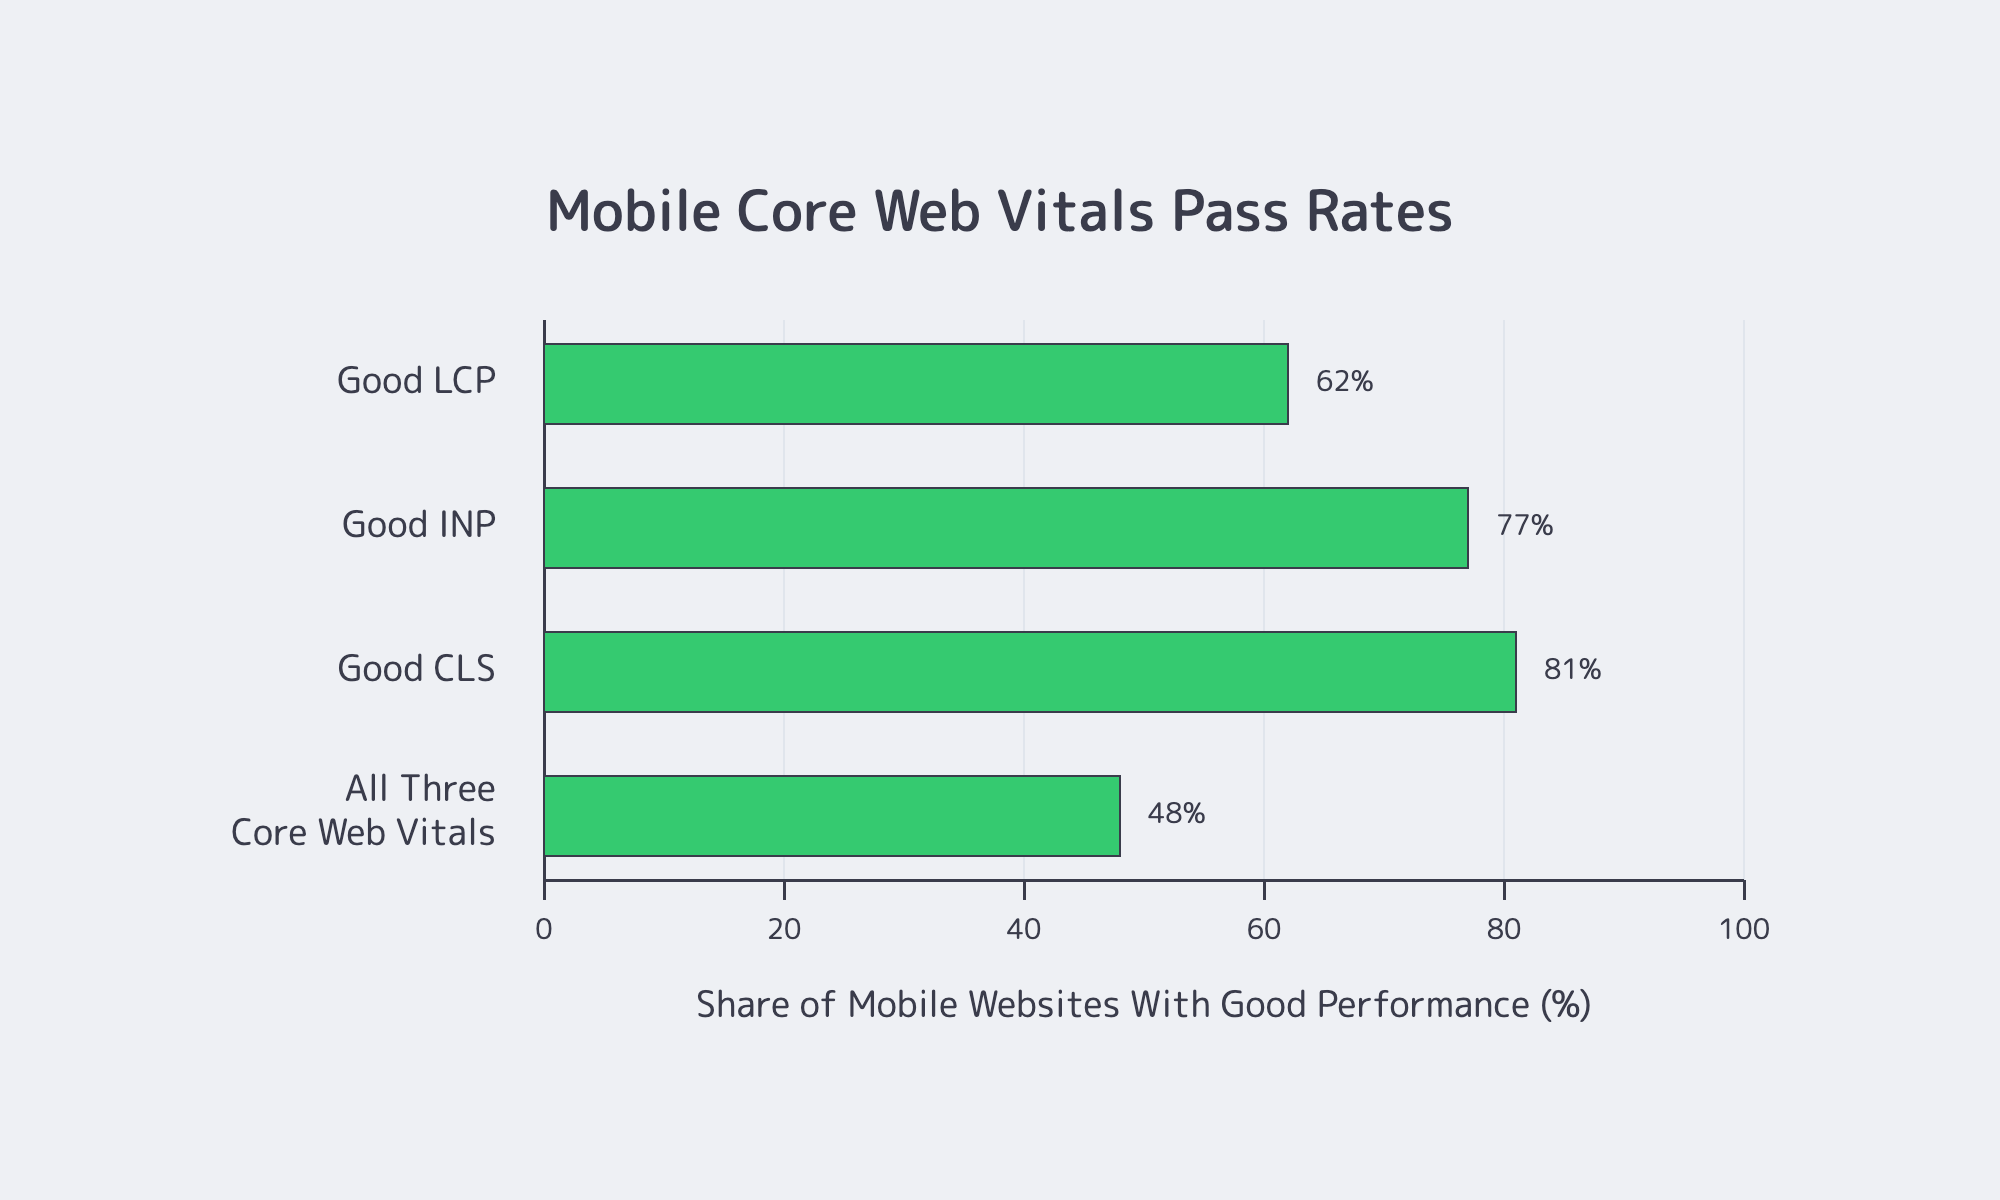
Core Web Vitals measure three different aspects of website performance: Largest Contentful Paint (LCP) tracks loading, Interaction to Next Paint (INP) measures responsiveness, and Cumulative Layout Shift (CLS) measures visual stability. Google’s “good” thresholds are LCP ≤2.5 seconds, INP ≤200 milliseconds, and CLS ≤0.1, evaluated at the 75th percentile (p75) of visits.
A CDN can improve network delivery, but it cannot automatically fix JavaScript execution or unstable layouts.
For ecommerce teams, the question is not whether a CDN makes websites faster. It’s which part of the performance bottleneck a CDN can actually remove.
CDN for Ecommerce– Edge caching for shared assets – Flexible HTTP header controls – Real-time analytics and raw logs |
|
Core Web Vitals and Their Bottlenecks
A CDN reduces the distance between shoppers and cacheable content, potentially improving response and transfer times. But it cannot control when browsers discover images, how JavaScript executes, or whether dynamic elements shift the page.
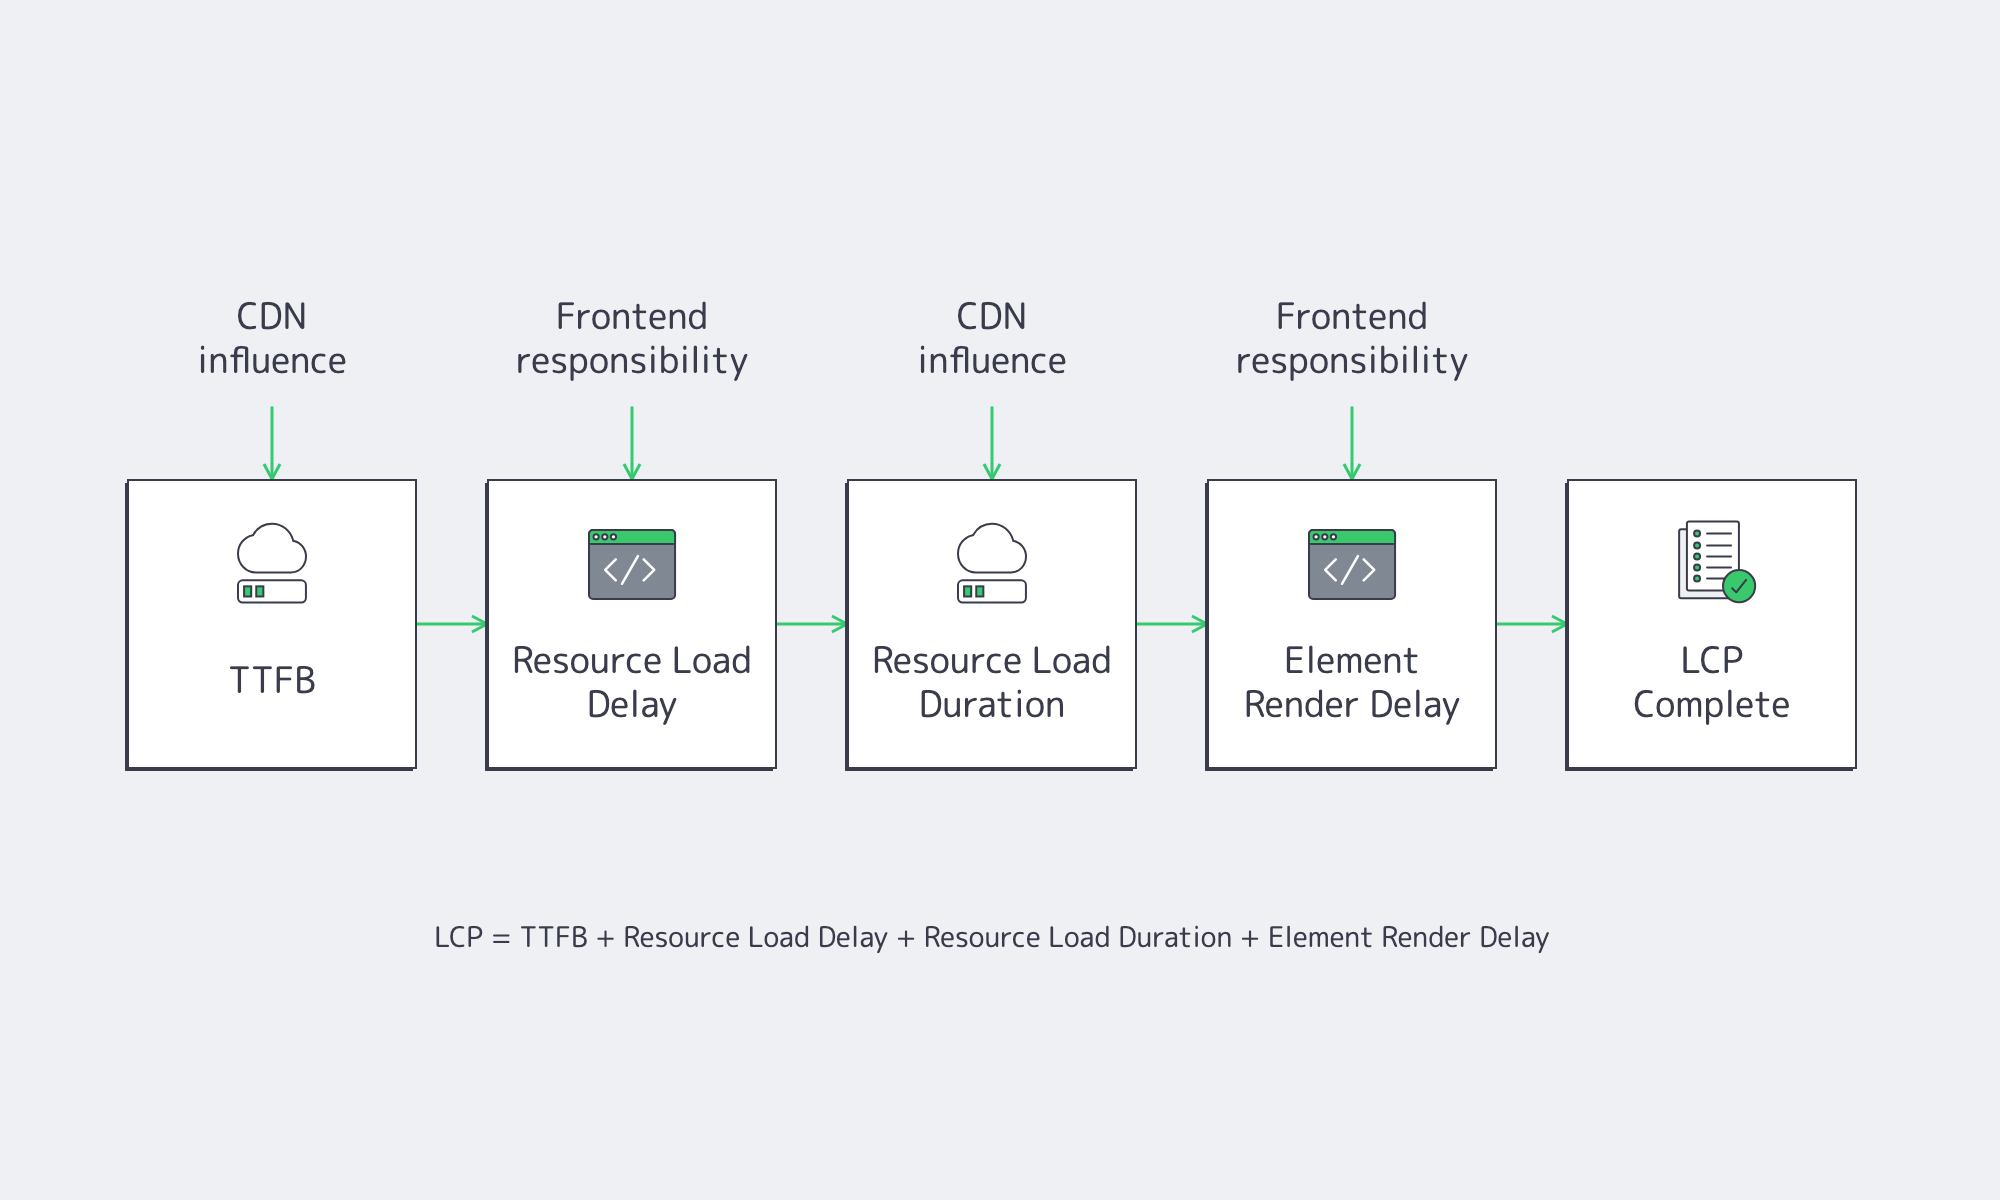
Google divides LCP into four components:
LCP = TTFB + resource load delay + resource load duration + element render delay
Each component has a different optimization path:
- Time to First Byte (TTFB): A CDN can reduce latency by serving cacheable responses from nearby edge locations.
- Resource load delay: Frontend changes, including earlier resource discovery and prioritization, usually matter more.
- Resource load duration: CDN delivery and smaller assets can shorten downloads.
- Element render delay: Render-blocking resources, JavaScript execution, and client-side rendering generally require application changes.
Google’s LCP optimization guidance emphasizes that reducing transfer time does not necessarily improve LCP when rendering remains blocked.
When Can a CDN Improve Ecommerce LCP?
A CDN can improve LCP when real-user measurements identify high TTFB, prolonged resource transfers, or repeated origin requests as major contributors. Edge caching is particularly useful for geographically distributed shoppers requesting shared assets. However, when resource discovery or browser rendering dominates LCP, frontend changes will deliver more meaningful improvements than CDN adoption.
Where Edge Caching Helps
Consider an ecommerce store with application infrastructure in one region and shoppers across several continents. Without edge caching, product imagery may repeatedly travel from the distant origin.
A CDN can serve cached assets closer to shoppers, reducing distance and origin requests.
Cache configuration matters equally. Inefficient cache keys, short freshness periods, and unnecessary query parameters can increase cache misses. Google recommends appropriate shared-cache directives, including s-maxage, to control response freshness.
However, personalized account pages, carts, checkout responses, and inventory-sensitive content require careful cache policies. Google’s TTFB guidance warns that authenticated content may still require origin processing.
For shared product images and other cacheable assets, Melbicom’s CDN provides edge caching, geographic request routing, and HTTP header controls. Teams can configure freshness and route requests through edge locations serving their audience.
How to Improve LCP by Reading the Four Subparts
Google’s LCP optimization guidance recommends examining the contribution of each subpart rather than treating the total LCP value as a single bottleneck.
Consider a hypothetical product page with 3.2-second LCP.
If TTFB consumes 1.3 seconds, infrastructure should investigate network latency, cache misses, and origin processing. Navigation Timing and Server-Timing can help separate these contributors.
If the image request starts one second after HTML arrives, the problem is probably resource discovery. The frontend team should expose the image in initial HTML, avoid lazy-loading the LCP element, and consider fetchpriority=”high”.
Image size matters too. Google’s responsive-image guidance notes that desktop-sized images delivered to mobile devices can consume two to four times more data than necessary. Responsive sizing and format selection therefore belong alongside CDN delivery in an LCP optimization plan.
Finally, if 1.1 seconds of the hypothetical 3.2-second LCP is render delay, delivering the image faster may achieve little. The browser still needs to finish rendering work.
Faster delivery does not guarantee earlier paint.
Why INP and CLS Can Stay Poor With a CDN
INP and CLS can remain poor because CDN optimization primarily affects network delivery, not browser execution or layout stability. INP exceeds its good threshold above 200 milliseconds when interactions involve excessive processing or rendering. CLS exceeds 0.1 when images, fonts, or dynamically inserted components unexpectedly move content, regardless of delivery speed.
Why INP Remains a Frontend Problem
INP measures three phases: input delay, event-handler processing, and presentation delay.
Suppose an ecommerce variant selector records 30 milliseconds of input delay, 230 milliseconds of JavaScript processing, and 40 milliseconds of presentation delay.
Moving its JavaScript bundle to a nearby CDN does not eliminate the 230 milliseconds of work triggered by the interaction.
Frontend engineers must instead simplify event handlers, defer unnecessary operations, break up long tasks, and reduce rendering work. Google’s INP optimization guidance recommends minimizing callback work and yielding to the main thread.
A CDN can indirectly improve startup responsiveness by delivering resources earlier, but downloaded JavaScript still requires parsing, compilation, and execution.
Why CLS Needs Layout Fixes
CLS commonly results from missing image dimensions, late-inserted banners, unreserved widget space, and font swaps.
A CDN may deliver an image sooner, but missing width, height, or aspect-ratio information can still cause layout movement.
Google recommends reserving space for asynchronous content and managing font geometry using appropriate fallback fonts and CSS metric overrides.
CDN Limits: What Stays in the Browser
A CDN changes arrival times. Core Web Vitals also measure browser work.
For INP, real-user monitoring must capture actual interactions such as opening carts, selecting variants, or changing quantities. Google’s field interaction guidance recommends recording interaction targets and latency phases.
For CLS, post-load shifts may occur during scrolling, personalization, or dynamic content insertion. A page-load-only laboratory test can miss them.
How Should Diagnostics Guide Infrastructure and Frontend Fixes for Core Web Vitals?
Core Web Vitals diagnostics should identify the slowest phase before assigning remediation work. Start with p75 field measurements, segment results by device, geography, and page type, then reproduce the issue in laboratory tools. Infrastructure should address delivery and origin bottlenecks; frontend teams should address resource discovery, JavaScript execution, rendering, and unstable layouts.
Measure Field Performance First
Chrome UX Report (CrUX) provides real-user performance measurements using a rolling 28-day aggregation window updated daily. Its API also exposes LCP resource information and image-LCP subparts.
That window is useful for sustained performance assessment but insufficient for immediate deployment feedback.
First-party real-user monitoring (RUM) can segment performance by geography, release, device, and page template. Chrome DevTools can then help reproduce LCP timing, interaction latency, and layout shifts.
A useful CDN experiment has a measurable hypothesis: reduce mobile product-page p75 LCP in a specific region by shortening TTFB and image transfer time without changing frontend code.
Melbicom’s CDN analytics and raw logs can help examine delivery behavior alongside browser RUM and origin monitoring.
Improve LCP with Clear Team Ownership
| Diagnostic signal | Infrastructure / CDN responsibility | Website development responsibility |
|---|---|---|
| High LCP TTFB | Investigate cache misses, routing, origin latency, redirects, and capacity | Reduce server-side rendering and application processing |
| High resource load delay | Check connection setup where relevant | Expose LCP assets in HTML; remove lazy loading; prioritize requests |
| High resource load duration | Optimize caching, regional routing, and origin fetches | Reduce image sizes; implement responsive formats |
| High element render delay | Confirm delivery is not the bottleneck | Remove render blockers and excessive main-thread work |
| Poor INP | Investigate delivery-related startup contention | Optimize event handlers, long tasks, JavaScript, and rendering |
| Poor CLS | Investigate avoidable late resource arrivals | Reserve layout space; control fonts and dynamic content |
Ownership should follow measured bottlenecks, not metric names.
For example, infrastructure might reduce an image transfer by 250 milliseconds while application initialization still delays its visibility by 700 milliseconds. Network performance improves, but LCP may barely change.
Frontend engineers may remove image discovery delays, then expose a slow transfer from a distant origin. CDN optimization becomes the next step.
Origin performance also matters. A cache miss still reaches the origin, so teams need to examine application latency, database behavior, queue pressure, and resource saturation alongside cache performance.
Use a CDN to Improve LCP Where the Waterfall Says It Will

CDN adoption works best as a targeted response to measured network bottlenecks. Edge caching and shorter delivery paths can improve LCP when TTFB or resource transfer dominates. INP usually requires JavaScript and rendering optimization, while CLS depends on stable layout geometry.
Measure before and after deployment, separating cached and uncached responses and tracking regional p75 performance. The objective is not simply faster delivery, but a measurable improvement in what shoppers experience.
For the next performance rollout, use these findings to make the work actionable:
- Define the failing cohort: Identify the affected page template, device class, and geography before selecting an optimization.
- Measure the critical path: Record LCP subparts, relevant interaction phases, and layout-shift attribution rather than relying on a single performance score.
- Control the comparison: Separate cache hits from misses, keep unrelated frontend changes out of the test, and verify personalized content remains correct.
- Assign the next bottleneck: Recheck field performance after each change and transfer ownership when the limiting phase shifts between delivery and browser execution.
Where Melbicom CDN Fits
Use Melbicom CDN edge caching, geographic routing, and delivery analytics to address measured delivery bottlenecks. Compare results with browser and origin monitoring to guide the next performance change.
Get expert support with your services
Blog

How to Calculate Video Streaming Bandwidth and Delivery Costs
Video streaming creates two infrastructure demands that are easy to confuse: monthly delivery volume, which determines how much data a CDN transfers, and peak capacity, which determines how much throughput the delivery network must sustain when viewers arrive simultaneously.
These two measurements require different inputs. Monthly volume depends on bitrate, viewing duration, and audience size. Peak capacity depends on how many viewers watch simultaneously and the bitrate they receive.
Here’s how to calculate those requirements for an on-demand library, recurring live programming, and a major live event.
Video Delivery– HLS and DASH delivery – Premium and Volume plans – Traffic-based plan selection |
|
What Inputs Does a Video Streaming Bandwidth Calculator Need?
A realistic video streaming bandwidth calculator needs average delivered bitrate, actual viewing duration, audience or session count, peak concurrent viewers, and explicit overhead assumptions. Monthly transfer estimates should use average delivered bitrate and viewer-hours. Peak capacity estimates require simultaneous audience size and a peak planning bitrate, with additional headroom for traffic variation.
Use Weighted Bitrate
Adaptive-bitrate (ABR) streaming changes video quality as network conditions fluctuate. Using the highest available rendition for every session can substantially overestimate delivery volume.
IETF RFC 8216 distinguishes AVERAGE-BANDWIDTH, the average segment bitrate, from BANDWIDTH, the peak segment bitrate.
A streaming bandwidth calculator should weight bitrate by actual viewing time:
Weighted bitrate = Σ (rendition viewing share × average bitrate)
Assume 55% of viewing time at 5 Mbps, 30% at 3 Mbps, and 15% at 1.5 Mbps.
(0.55 × 5) + (0.30 × 3) + (0.15 × 1.5) = 3.875 Mbps
Include audio and container data in the aggregate delivered rate, but do not add them again if the measured bitrate already includes them.
Codec efficiency also matters because different encoding configurations can produce different bitrates at comparable visual quality. Apple’s HLS authoring guidance explains that bitrate depends on codec, encoder, frame rate, resolution, content complexity, and target quality. Use the measured bitrate of the encoding ladder intended for delivery rather than assuming a fixed saving from a codec change.
Calculate Actual Viewer-Hours
Catalog duration is not viewing duration.
Use actual watch time:
VOD viewer-hours = monthly viewers × sessions/viewer × hours/session
Live viewer-hours = events/month × unique viewers/event × hours watched
Track unique, average concurrent, and peak concurrent viewers separately. A large monthly audience does not imply many simultaneous viewers.
For the worked examples, assume a 3% monthly delivery allowance (O = 1.03) for additional transferred bytes beyond the modeled media payload, and 25% peak capacity headroom (H = 1.25) for throughput planning. The examples’ aggregate delivered bitrates already include audio and container data. The factors apply separately to monthly volume and peak capacity.
How Should Monthly Streaming Volume and Peak Capacity Be Calculated Separately?
Monthly streaming volume equals viewer-hours multiplied by average delivered bitrate and a byte-conversion factor. Peak capacity equals peak concurrent viewers multiplied by peak planning bitrate and engineering headroom. At 1 Mbps, one viewer-hour transfers 0.45 GB. Monthly terabytes determine transfer-cost exposure, while peak gigabits per second determine simultaneous delivery requirements.
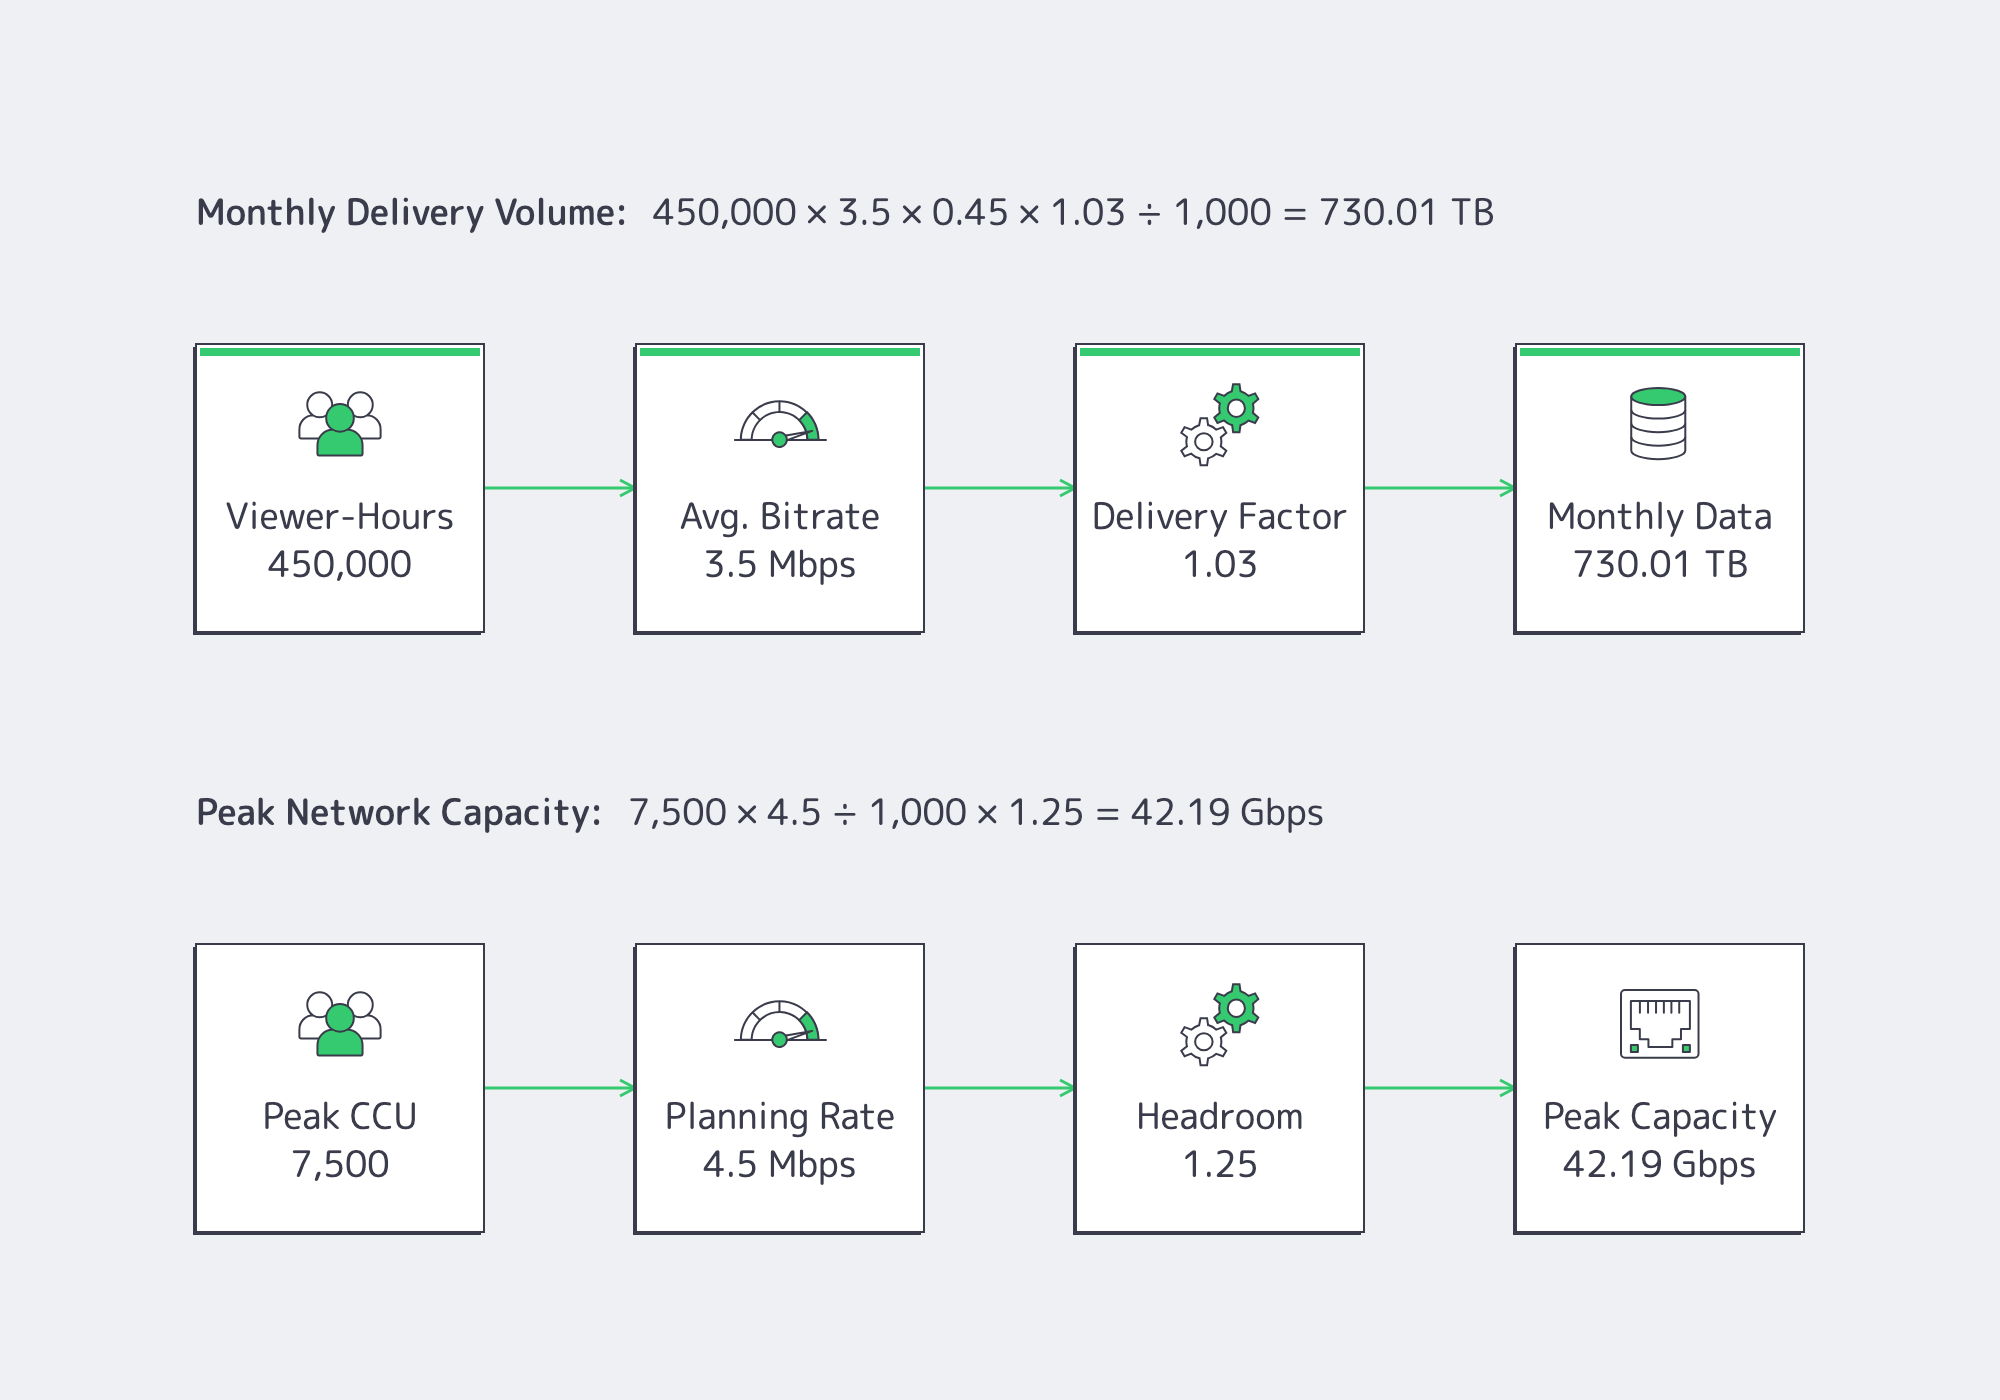
Monthly Delivery Volume
Using decimal units:
1 Mbps × 3,600 seconds ÷ 8 = 0.45 GB
GB/month = viewer-hours × average Mbps × 0.45 × O
Assume 1 TB = 1,000 GB and 1 PB = 1,000 TB. Check the billing units.
Peak Concurrent Capacity
The peak planning bitrate should reflect segment behavior and the expected rendition mix during peak demand, not simply the monthly average.
Peak Gbps = peak CCU × peak planning Mbps ÷ 1,000 × H
Apple’s HLS guidance distinguishes average and peak segment rates, with different measurement expectations for VOD and live streams. That makes measured manifests and playback telemetry more useful than a fixed multiplier applied indiscriminately.
Monthly Volume and Peak Capacity
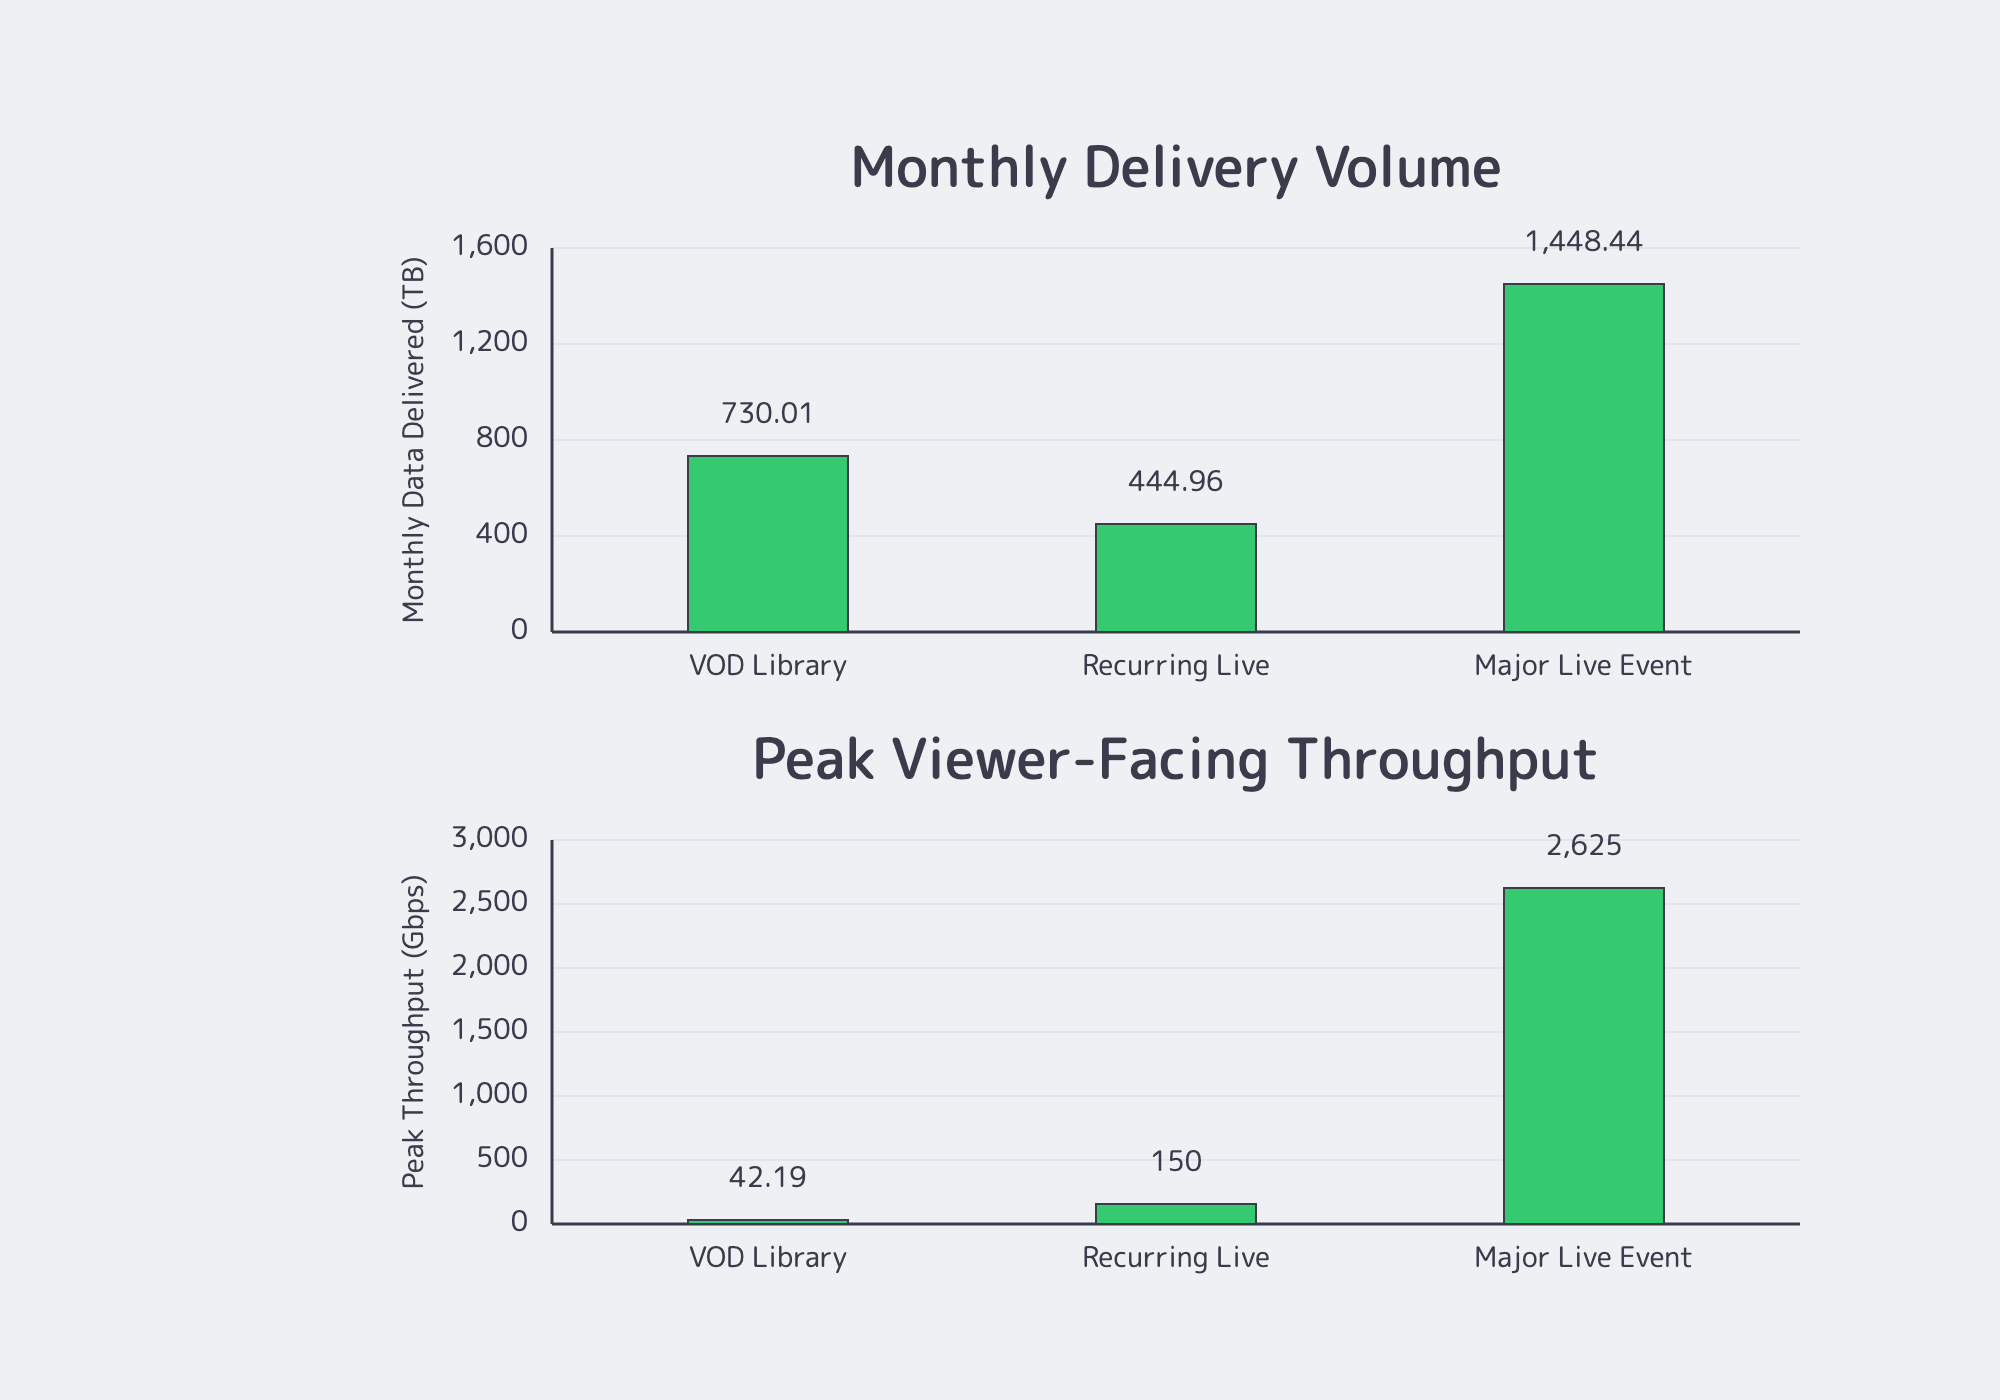
| Workload | Viewer-hours/month | Delivery volume | Peak CCU | Planned peak egress |
|---|---|---|---|---|
| VOD library | 450,000 | 730.01 TB | 7,500 | 42.2 Gbps |
| Recurring live | 192,000 | 444.96 TB | 20,000 | 150 Gbps |
| Major live event | 625,000 | 1,448.44 TB | 300,000 | 2,625 Gbps |
The VOD library transfers approximately 64% more monthly data than recurring live programming, yet recurring live requires approximately 3.6 times the peak throughput.
That difference is why converting monthly terabytes into average Gbps cannot establish sufficient live-streaming capacity.
VOD and Live Delivery Costs
Delivery costs depend on total viewer-hours, delivered bitrate, and applicable CDN pricing, but capacity requirements change dramatically with concurrency. VOD spreads consumption across many sessions, recurring broadcasts concentrate demand into scheduled windows, and major events produce extreme simultaneous loads. Each workload needs separate monthly-volume and peak-throughput calculations using explicit audience assumptions.
VOD Library: Bandwidth Requirements
Assume 50,000 monthly viewers, 12 sessions per viewer, 45 minutes watched per session, 3.5 Mbps average delivered bitrate, 7,500 peak concurrent viewers, and 4.5 Mbps peak planning bitrate.
Viewer-hours: 50,000 × 12 × 45/60 = 450,000
Monthly volume: 450,000 × 3.5 × 0.45 × 1.03 = 730,012.5 GB = 730.01 TB
Peak capacity: 7,500 × 4.5 ÷ 1,000 × 1.25 = 42.19 Gbps
Melbicom’s Volume Plus 500 CDN plan includes 500 TB for €1,500 monthly, with additional traffic at €0.003/GB.
€1,500 + (730,012.5 − 500,000) × €0.003 = €2,190.04/month
This CDN transfer calculation assumes all modeled traffic is eligible for the plan and excludes encoding, storage, origin infrastructure, taxes, and other charges.
Recurring Live: Scheduled Concurrency
Assume 12 broadcasts monthly, each lasting two hours, with 30,000 unique viewers per event, 32 minutes of average viewing, 5 Mbps average bitrate, 20,000 peak concurrent viewers, and 6 Mbps peak planning bitrate.
Viewer-hours: 12 × 30,000 × 32/60 = 192,000
Monthly volume: 192,000 × 5 × 0.45 × 1.03 = 444,960 GB = 444.96 TB
Peak capacity: 20,000 × 6 ÷ 1,000 × 1.25 = 150 Gbps
Under Melbicom’s same Volume Plus 500 plan, monthly transfer fits within the 500 TB allowance, producing a €1,500 monthly CDN charge for the modeled workload.
Yet the required peak capacity is more than three times the VOD example. Scheduled viewing concentration, not monthly volume, drives that difference.
Major Live Event: Plan for Terabit-Scale Peaks
Assume one four-hour event with 500,000 unique viewers, 75 minutes of average viewing, 5 Mbps average bitrate, 300,000 peak concurrent viewers, and 7 Mbps peak planning bitrate.
Viewer-hours: 500,000 × 75/60 = 625,000
Monthly volume: 625,000 × 5 × 0.45 × 1.03 = 1,448,437.5 GB = 1.448 PB
Peak capacity: 300,000 × 7 ÷ 1,000 × 1.25 = 2,625 Gbps = 2.625 Tbps
At this scale, the appropriate Melbicom CDN cost output is Enterprise quote required, rather than extrapolating a lower-volume package.
A multi-terabit event needs regional capacity planning: aggregate network throughput differs from the capacity available for a particular audience distribution.
For a major event, our team can work with the expected traffic volume, geographic distribution, and peak throughput requirements to plan the delivery configuration.
Origin and Viewer-Facing Bandwidth
A 2.625 Tbps CDN delivery requirement does not imply 2.625 Tbps of origin egress.
In Melbicom’s live-sports streaming architecture, cacheable segments pass from packaging and origin infrastructure into CDN delivery.
A first-order estimate is:
Origin bytes ≈ CDN-delivered bytes × cache-miss ratio
This approximation assumes the cache-miss ratio represents origin-fetched bytes relative to edge-delivered bytes, not simply the percentage of requests that miss.
Actual origin requirements depend on cache-fill patterns, geographic distribution, cache keys, shielding, and failover. Use measured origin-fetch telemetry rather than estimating origin throughput directly from peak CCU.
From Calculations to Capacity
A useful video streaming bandwidth calculator produces three outputs: monthly delivered TB, peak viewer-facing Gbps, and origin-fetch requirements.
Each answers a different engineering question. Monthly transfer determines delivery-cost exposure. Peak throughput establishes simultaneous capacity needs. Origin-fetch traffic informs upstream infrastructure sizing.
For implementation, use the following checks:
- Measure actual watch duration and rendition-level viewing time rather than assuming complete playback.
- Calculate monthly bytes from viewer-hours and weighted average bitrate, ensuring audio and overhead are counted only once.
- Calculate peak Gbps independently from peak CCU and planning bitrate, using peak-time rendition data where available.
- Validate overhead, headroom, and cache-miss assumptions against telemetry.
- Check regional audience concentration and available delivery capacity before major events, rather than relying on aggregate network figures.
Melbicom’s CDN offers Premium destination-zone pricing and Volume traffic-oriented plans. The right selection depends on where viewers are located, how much data they consume, and whether the delivery footprint matches their distribution.
A useful optimization test is:
New monthly volume ≈ old volume × new average bitrate / old average bitrate
Reducing the VOD example’s weighted bitrate from 3.5 to 3.15 Mbps cuts modeled monthly delivery by approximately 73 TB, with viewer-hours and overhead unchanged. Test whether the encoding change preserves acceptable quality.
Choose Capacity from Bytes and Peaks

Monthly consumption and instantaneous demand require separate capacity calculations. Under the stated assumptions, 730 TB of VOD needs roughly 42 Gbps at peak, while the 1.448 PB major event needs 2.625 Tbps.
The strongest forecasts combine playback analytics, measured bitrates, concurrency profiles, and CDN telemetry. They turn an estimated transfer bill into an actionable capacity plan.
Match CDN Capacity to Your Workload
Deliver pre-transcoded HLS and DASH with Melbicom CDN. Compare Premium and Volume plans using your audience geography, monthly transfer, and peak delivery needs.
Get expert support with your services
Blog

Melbicom at DAYS Singapore 2026: A Web3 Infrastructure Perspective
Melbicom joined DAYS Singapore as a sponsor on October 6, 2026. The event brought together allocators, asset managers, and service providers focused on institutional participation in onchain finance.
From our infrastructure perspective, two priorities remain central for teams building and operating Web3 services:
- Workload fit: matching server resources to the service’s requirements.
- Operational clarity: defining who manages infrastructure and who runs software.
Web3 Infrastructure with Melbicom
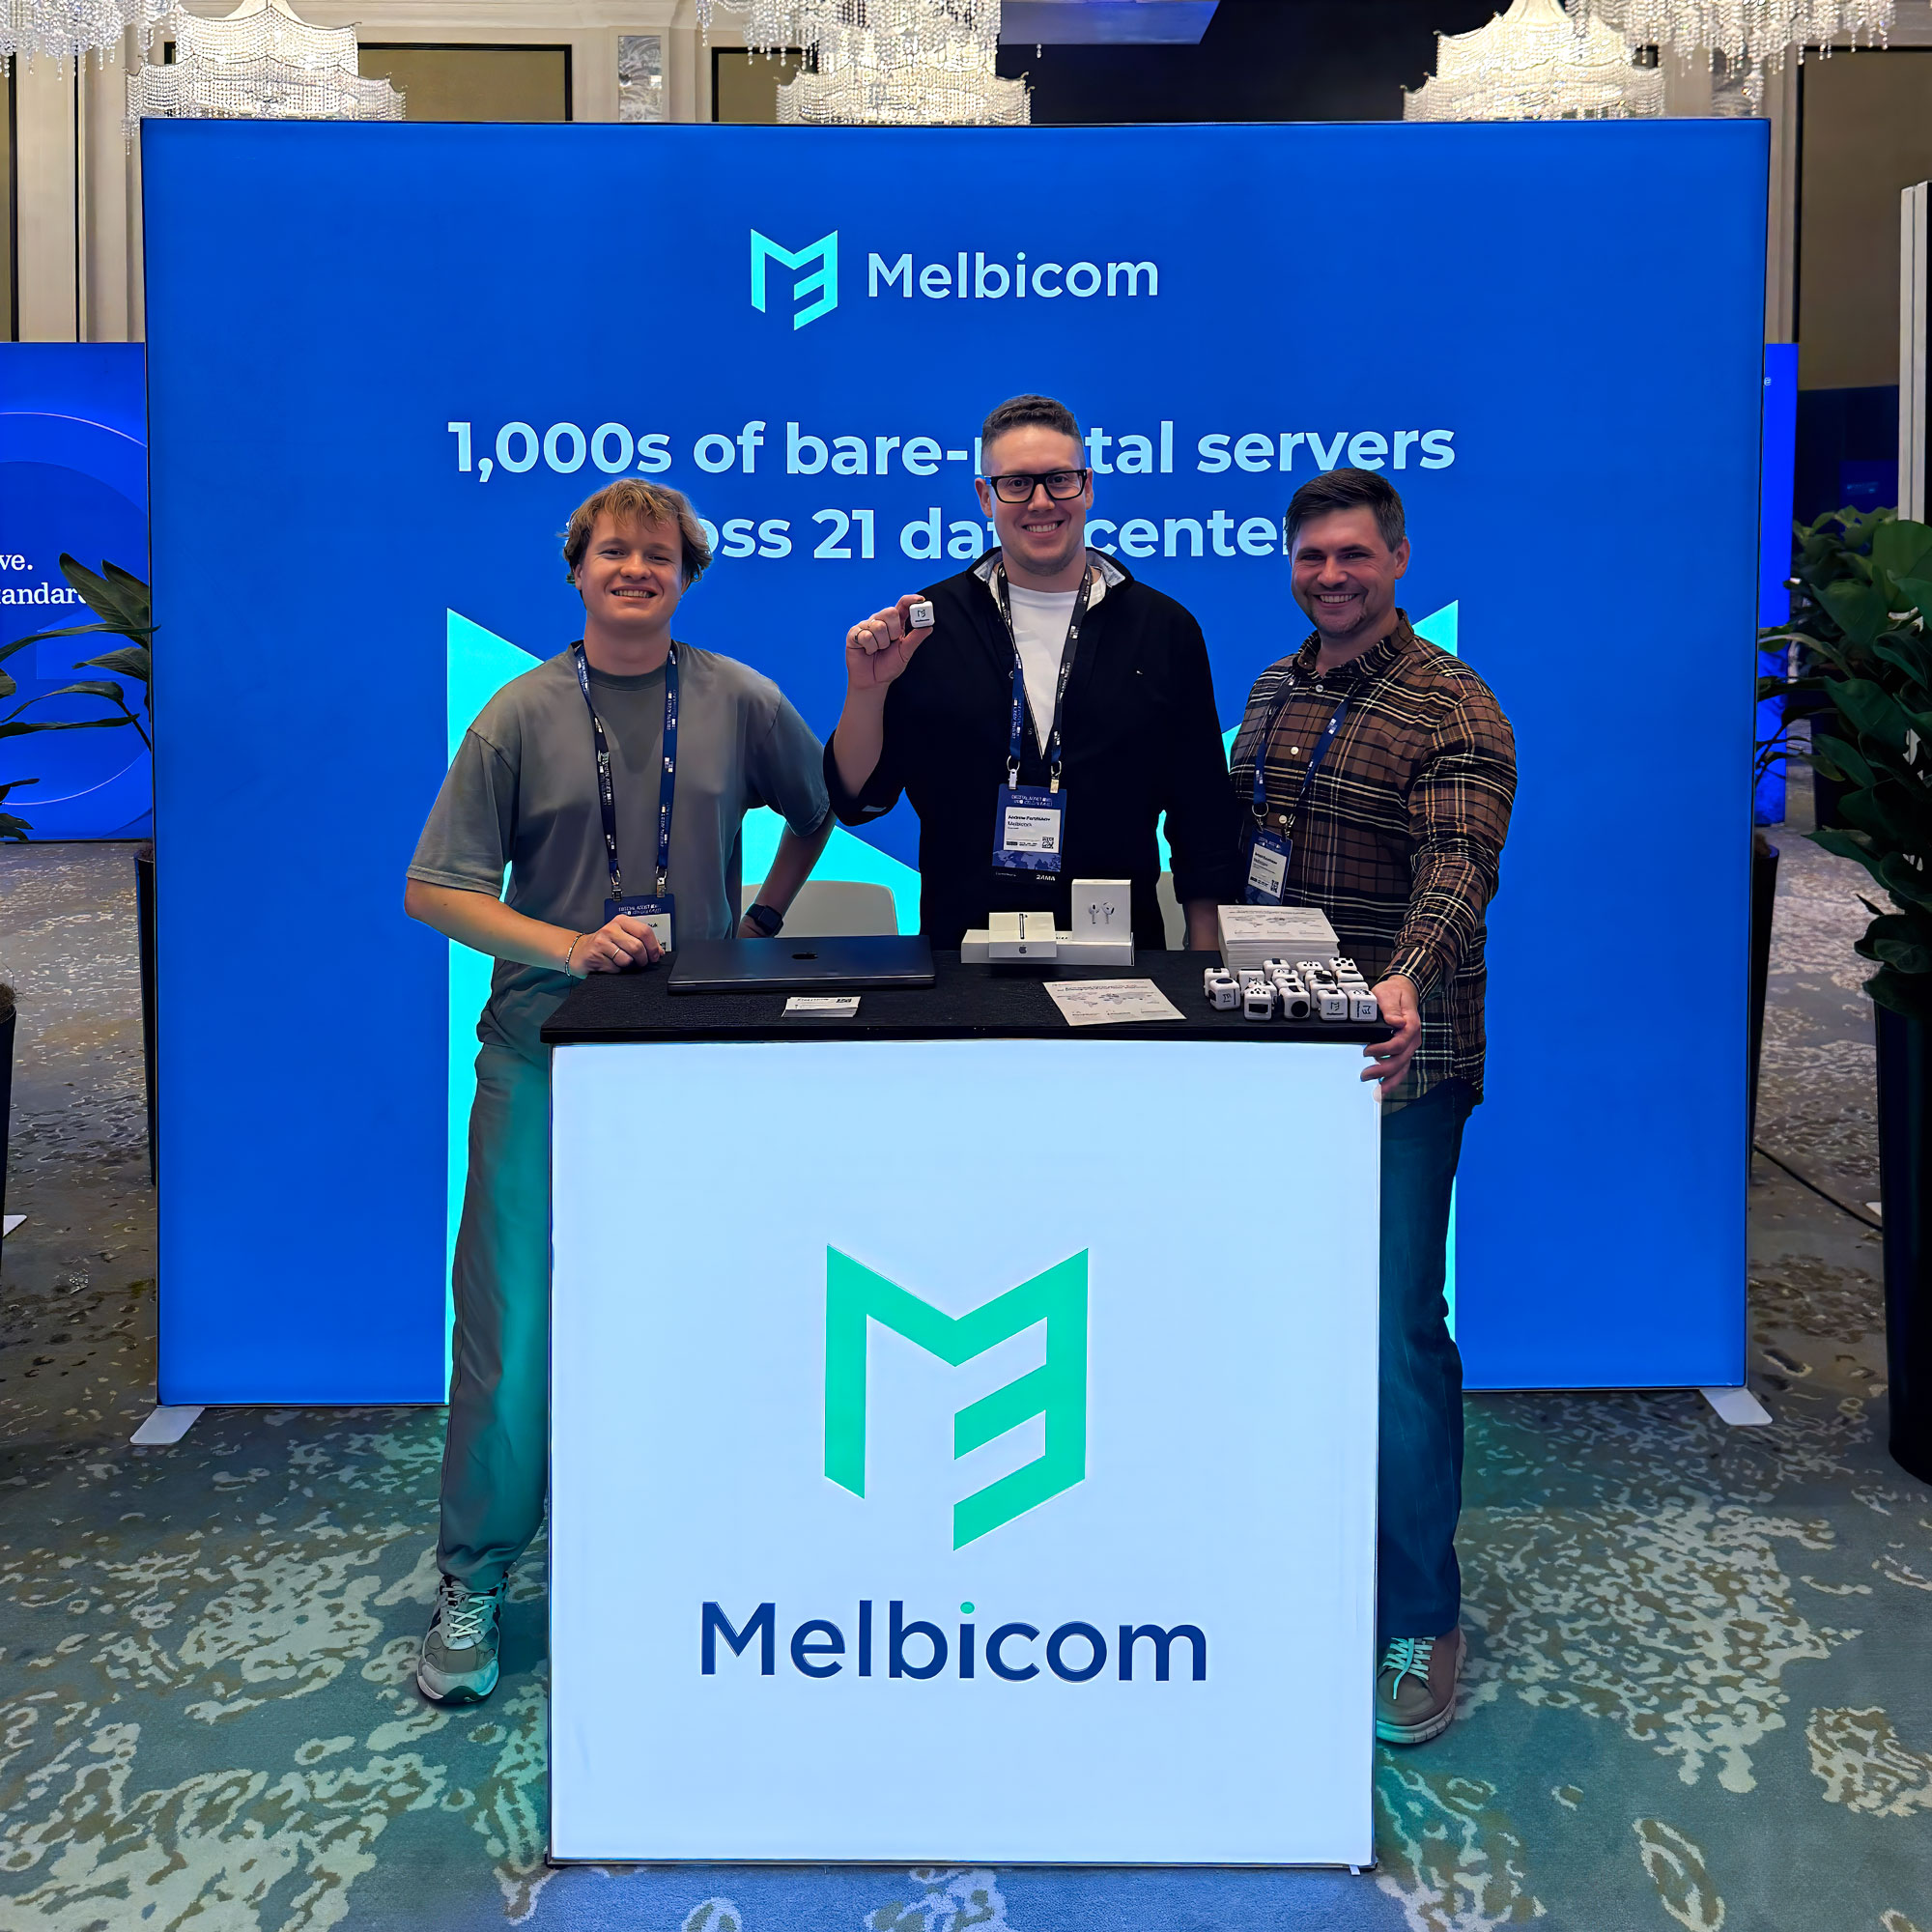
Our Web3 hosting infrastructure combines dedicated servers with a global footprint of 21 data centers across 5 continents, giving teams a choice of regions for their deployments.
Ready-to-go and custom configurations let teams match compute, storage, and bandwidth to their workloads. Melbicom manages the hardware and network and provides 24/7 support, so your team can focus on its Web3 services.
Thank you to the DAYS team and everyone we met in Singapore.
Get expert support with your services
Blog
Web3 Hosting Providers: Compare Validator, RPC and Indexer Support
Web3 hosting providers face three distinct infrastructure challenges. Validators perform consensus duties where failures can trigger financial penalties. RPC nodes serve API requests under demanding latency and concurrency requirements. Indexers process blockchain data into searchable databases, with heavy storage and ingestion demands.
The right hosting decision depends on protocol requirements, workload isolation, recovery ownership, and regional availability—not a generic “blockchain-ready” label.
Melbicom provides dedicated Web3 infrastructure for these workloads, while customers retain responsibility for blockchain software, keys, monitoring, and application recovery.
Dedicated Servers– 1000+ ready-to-go configs – Custom server builds – 24/7 infrastructure support |
|
Which Web3 Hosting Providers Support Validator, RPC, and Indexer Workloads?
Web3 hosting providers support validators, RPC nodes, and indexers when their infrastructure meets each workload's compute, memory, storage, networking, and geographic requirements. The essential selection criterion is compatibility with current protocol and client guidance, plus sufficient recovery headroom.
Compare Validator Hosting and Signing Safety
A validator hosting service comparison must evaluate both performance and signing safety.
Ethereum validators face penalties for missed duties and potentially more severe slashing consequences for contradictory consensus messages. Recovery procedures must therefore prevent conflicting signing by multiple validator instances. Ordinary downtime and slashable behavior are distinct risks, as explained in Ethereum's consensus documentation.
Hardware requirements vary substantially between networks.
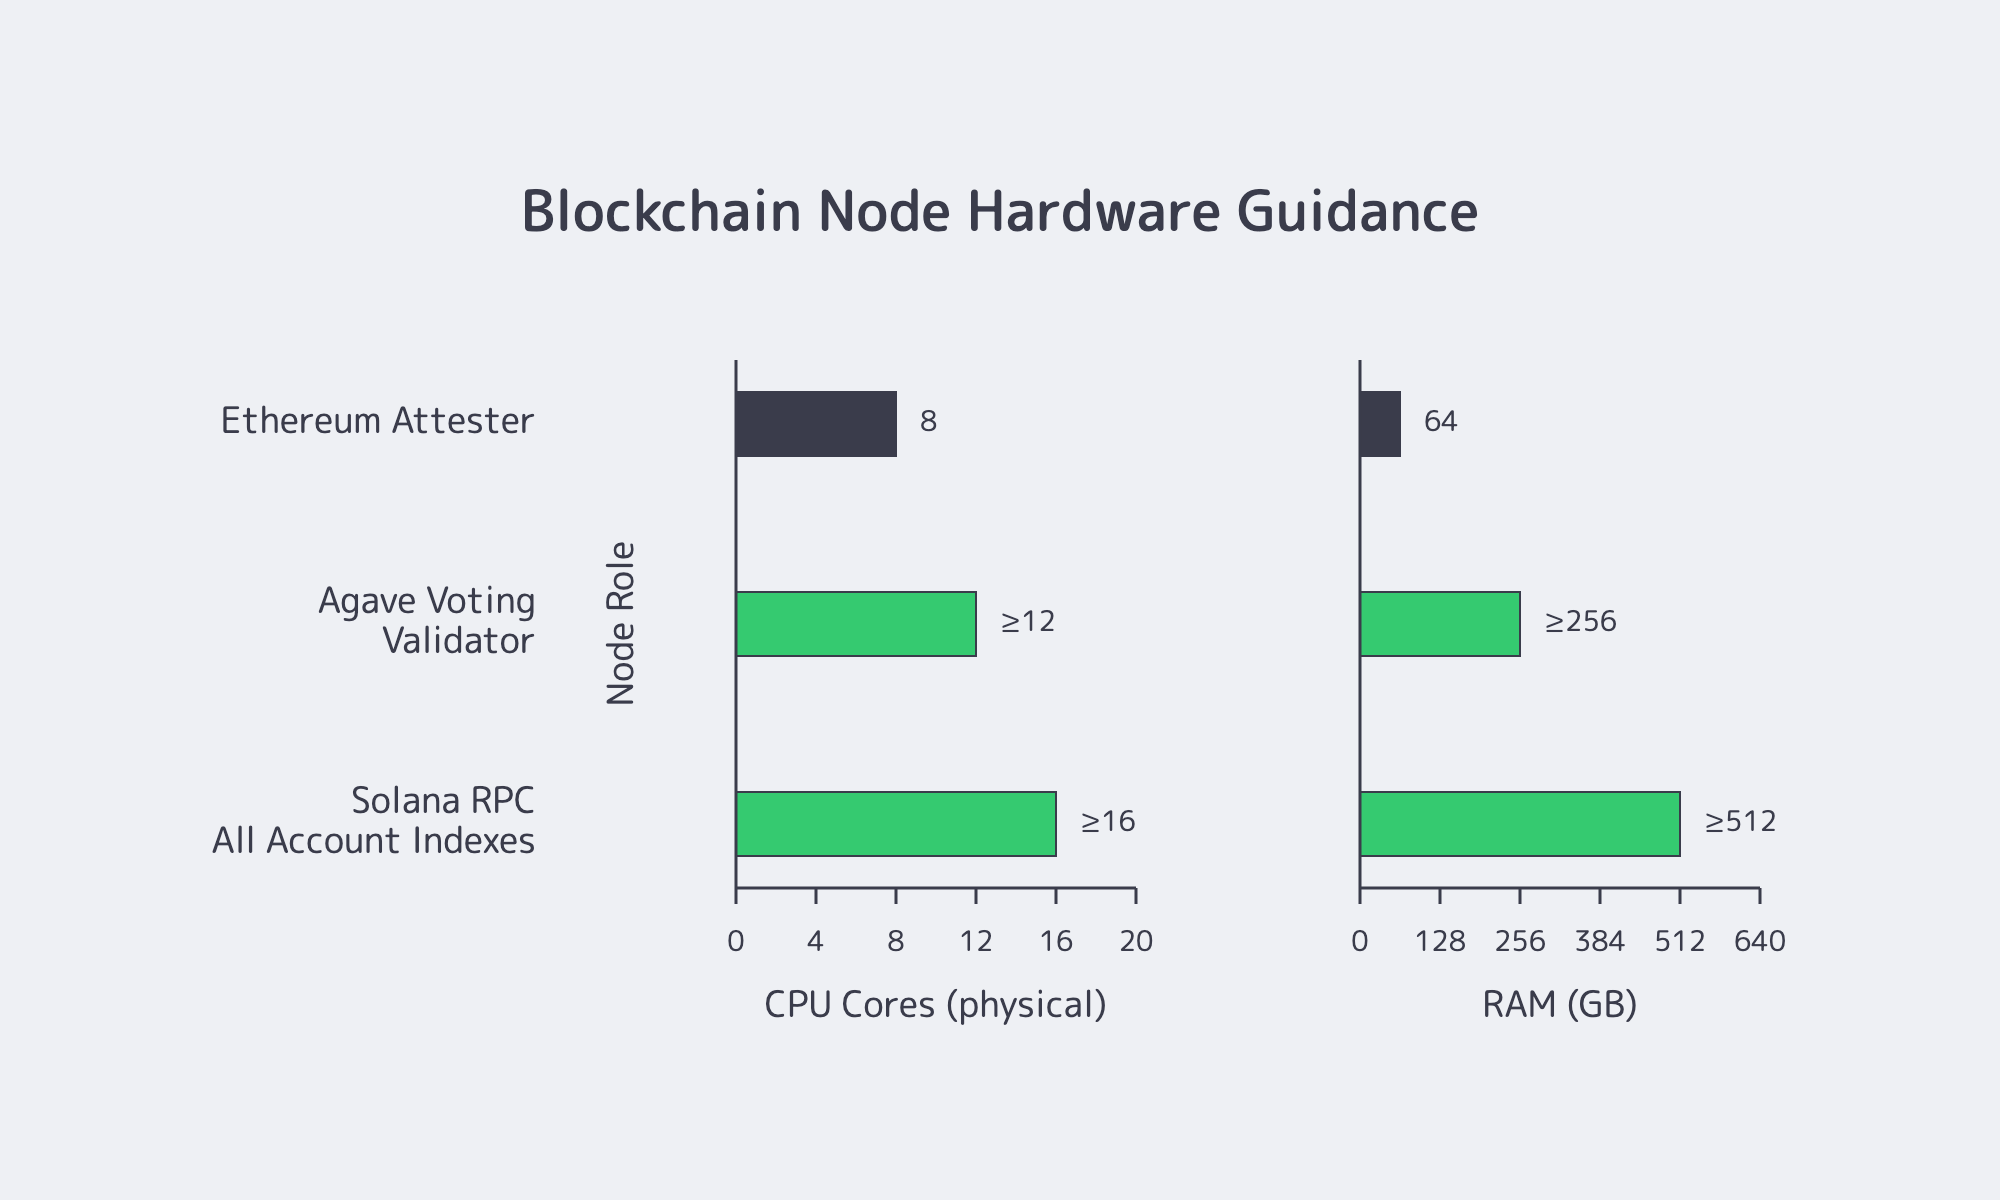
EIP-7870 is a living, informational Ethereum hardware recommendation—not a mandatory protocol minimum. For an attester, it recommends 8 cores/16 threads, 64 GB RAM, 4 TB NVMe, and 50 Mbps download/25 Mbps upload. Local block builders have higher network recommendations of 100 Mbps download/50 Mbps upload.
Solana needs more resources. Agave's hardware guidance recommends at least 12 cores/24 threads and 256 GB RAM for voting validators, with separate NVMe allocations:
- Accounts: at least 1 TB.
- Ledger: at least 1 TB.
- Snapshots: at least 500 GB.
Agave specifies symmetric connectivity of 1 Gbps for unstaked nodes and at least 2 Gbps for staked nodes, with 10 Gbps available bandwidth recommended.
These role-specific requirements provide the starting point for selecting CPU, memory, NVMe layout, and connectivity. The configuration must also accommodate synchronization and recovery without creating unsafe signing conditions.
RPC and Indexer Hosting: Performance Bottlenecks
RPC infrastructure prioritizes request throughput, concurrency, historical access, and response latency.
Agave recommends at least 16 cores/32 threads for Solana RPC configurations. Enabling all account indexes can raise memory requirements to 512 GB or more. Its RPC documentation discourages combining voting-validator and RPC responsibilities on one machine.
An RPC procurement specification should measure peak requests per second, method distribution, p95/p99 latency, subscription concurrency, and historical-query depth.
Indexers have different bottlenecks: sustained ingestion, database writes, secondary indexes, compaction, and historical backfills.
The choice of ingestion method also affects latency. Solana's indexing documentation distinguishes Geyser-based streaming from WebSocket subscriptions. For procurement, the useful test is whether the chosen ingestion path can maintain the application's required data freshness during peak activity and recovery.
Indexing capacity should be calculated from retained records, schema complexity, write amplification, and rebuilding requirements. Heavy backfills should not compete with production RPC requests for storage I/O.
Bare Metal Versus Managed Services: Duties and Recovery Ownership
Customer-operated dedicated infrastructure leaves blockchain clients, operating-system and protocol upgrades, keys, monitoring, backups, and recovery procedures under customer control. Managed delivery may transfer selected responsibilities, but only when explicitly defined. The critical distinction is recovery ownership: who detects failures, restores blockchain state, prevents unsafe validator failover, and confirms that services are operational again.
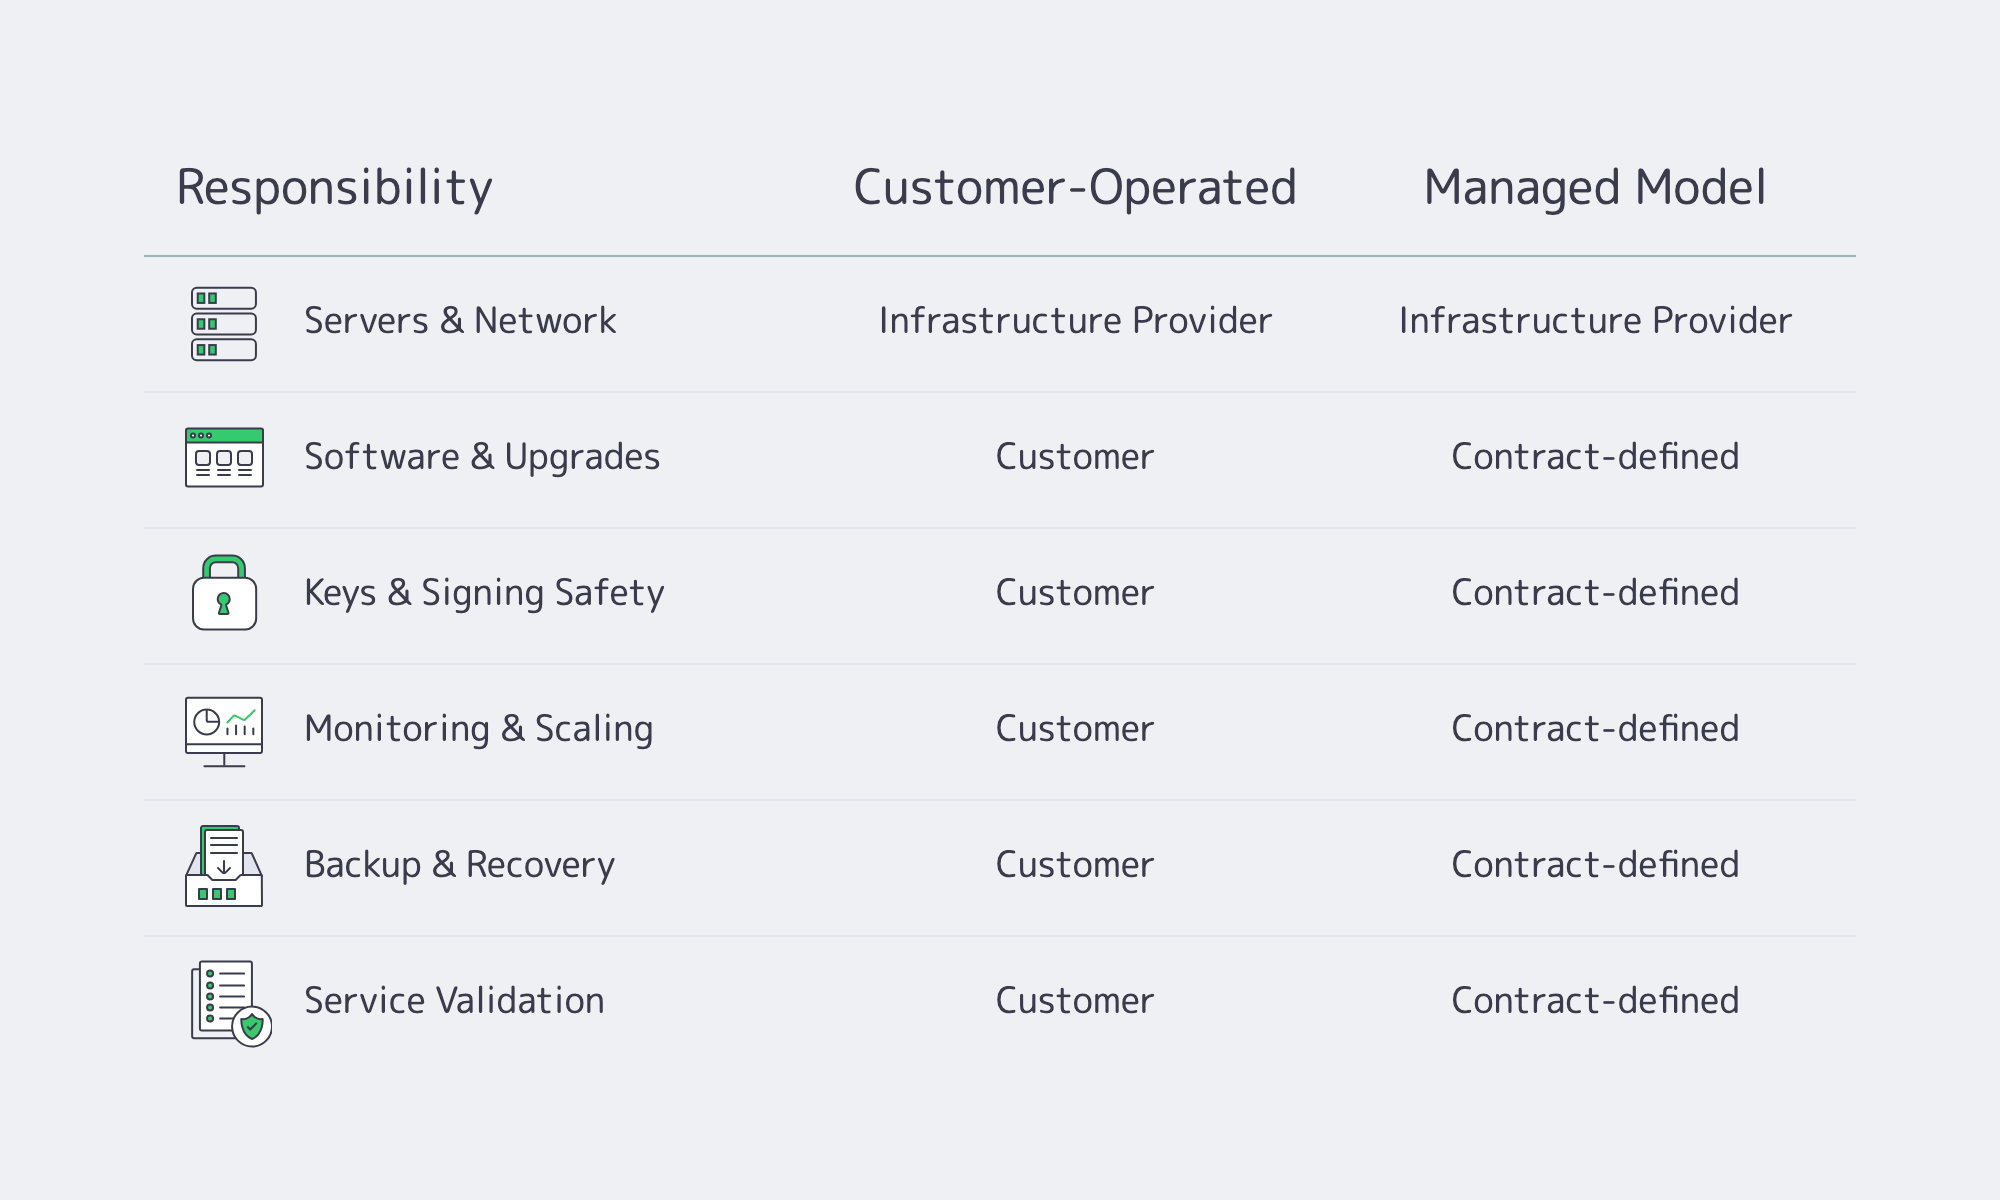
In Web3 terminology, bare metal commonly describes dedicated physical infrastructure.
Managed Blockchain Hosting Responsibilities: Define the Recovery Boundary
Melbicom supplies and supports the physical server and network infrastructure. Customers operate their blockchain workloads, including software installation, configuration, monitoring, scaling, and recovery.
A managed service model may include some of these functions, but the term “managed” alone establishes no specific blockchain responsibility.
Recovery ownership should be evaluated by workload.
Validators: The responsible operator must identify failures, preserve signing safety, restore client state, and confirm safe consensus participation. On Ethereum, conflicting signing can create slashing risk; restarting a validator is not inherently slashable.
RPC nodes: Recovery ends when the endpoint is synchronized and can successfully serve its required methods—not when replacement hardware boots.
Indexers: Recovery requires consistent database state, completed replay or backfill, and verification that no transaction records were missed.
For every operational function, procurement teams should establish who detects the problem, who executes recovery, and who validates the result. In a customer-operated deployment, that means planning application recovery separately from physical infrastructure support.
Web3 Storage, Regions and Payments
Before shortlisting Web3 hosting offers, verify usable storage capacity and I/O performance, actual server availability in the required city, and supported payment methods. A suitable configuration must accommodate active blockchain data, historical retention, and recovery overhead. Global infrastructure figures alone cannot establish local inventory, application latency, or eligibility to pay with Bitcoin.
Web3 Bare Metal Storage for Recovery
Storage procurement should account for more than the current blockchain database.
A practical sizing model is:
Required storage = active state + retained history + index expansion + database overhead + recovery workspace + growth reserve.
Recovery workspace includes temporary write-ahead logs, compaction space, rebuild files, and snapshots where applicable. These components must be sized for the selected protocol, client, retention policy, and recovery procedure.
Ethereum's node documentation distinguishes minimum hardware requirements from recommendations. Its recommended configuration references EIP-7870, which specifies 4 TB NVMe for an Ethereum full node and reference storage performance around 500 MB/s sequential throughput, 50,000 random 4K read IOPS, and 15,000 random 4K write IOPS.
Solana's separate accounts, ledger, and snapshot allocations demonstrate why total disk capacity alone is insufficient. Available SSD capacity also does not establish sustained IOPS, write endurance, or recovery time.
For active blockchain state, choose local storage that meets the protocol's I/O requirements. For snapshots and recovery artifacts, Melbicom offers S3-compatible object storage in Amsterdam alongside our dedicated storage servers. Object storage supports recovery workflows; active state still needs local NVMe.
Verify Server Regions and Availability
Start with workload geography rather than a provider's location count.
For validators, prioritize connectivity to relevant blockchain peers and the placement of recovery infrastructure. For RPC, identify where the largest share of requests originates, then include business-critical user regions. For indexers, consider proximity to the data source and the systems consuming indexed results.
Next, match those locations to actual server configurations.
Melbicom's data-center page provides the starting point for selecting a server city. Our dedicated-server configurations can then be evaluated against the workload's CPU, memory, storage, and bandwidth requirements.
Location-level hardware differences matter. Amsterdam has RAM options reaching 1,536 GB, Frankfurt up to 768 GB, and Singapore up to 576 GB. These options help shortlist memory-intensive RPC nodes requiring 512 GB or more.
A practical selection sequence is to identify the required region, filter configurations by the protocol's hardware guidance, check the storage layout, and establish the capacity needed for recovery or expansion.
Network evaluation should follow the same workload-specific approach. Measure latency and throughput from candidate locations to the blockchain peers, upstream data sources, and API users that matter most. Record p95 and p99 latency under representative load rather than relying on geographic proximity alone.
Our team can help select a location and configuration that fits these requirements. The resulting shortlist should contain complete server configurations, not just preferred cities.
Confirm Payment Eligibility Before Procurement
Melbicom's accepted payment methods include Visa, Mastercard, PayPal, UnionPay, Alipay, and cryptocurrency payments via BitPay.
For BitPay payments on dedicated servers, customers must complete the initial payment using another available method as part of mandatory KYC. Bitcoin through BitPay can then be used for renewals and new service orders.
Treasury teams should account for this initial-payment requirement and the applicable invoice details when planning procurement.
Web3 Hosting Requirements Worksheet
The worksheet turns technical specifications into procurement decisions.
Protocol compatibility, safe recovery, and required geography should be mandatory acceptance criteria. Capacity headroom, provisioning flexibility, and total operating cost can then determine the preferred configuration.
| Requirement | Evidence to Collect | Decision Rule |
|---|---|---|
| Workload role | Validator, RPC, indexer, archive, database | Create separate configurations |
| Protocol | Chain, client, version, node role | Meet current official guidance |
| CPU and RAM | Cores, threads, working-set memory | Preserve peak and recovery headroom |
| Active storage | Capacity, NVMe performance, endurance | Meet role-specific I/O requirements |
| History and indexes | Retention, archive depth, database schema | Size separately from active state |
| Recovery storage | Snapshots, WAL, rebuilds, compaction, growth | Support recovery without disk exhaustion |
| Network | Throughput, peer latency, p95/p99 RTT | Validate actual routes and load |
| Region | Server city, residency, recovery location | Confirm orderable capacity |
| Validator safety | Keys, signer state, failover controls | Prevent unsafe duplicate signing |
| RPC performance | Peak QPS, methods, latency, subscriptions | Meet measured endpoint targets |
| Indexer performance | Ingestion, writes, replay, queries | Isolate disruptive backfills |
| Operating ownership | Hardware, OS, clients, keys, monitoring, upgrades | Assign an accountable owner per task |
| Recovery objective | Detection, restoration, synchronization, validation | Measure usable service restoration |
| Availability | Exact hardware and replacement capacity | Verify current city inventory |
| Payment | First-order method, KYC, Bitcoin eligibility | Confirm checkout requirements |
| Total cost | Compute, storage, bandwidth, recovery, labor | Compare complete operating cost |
This worksheet keeps selection focused beyond headline specifications.
A configuration with sufficient CPU but inadequate storage endurance is not suitable. Neither is a geographically attractive server that cannot meet the required memory specification or recovery objective.
Choosing Web3 Hosting Providers by Workload, Not Marketing Category
Validator, RPC, and indexer fleets require different infrastructure decisions.
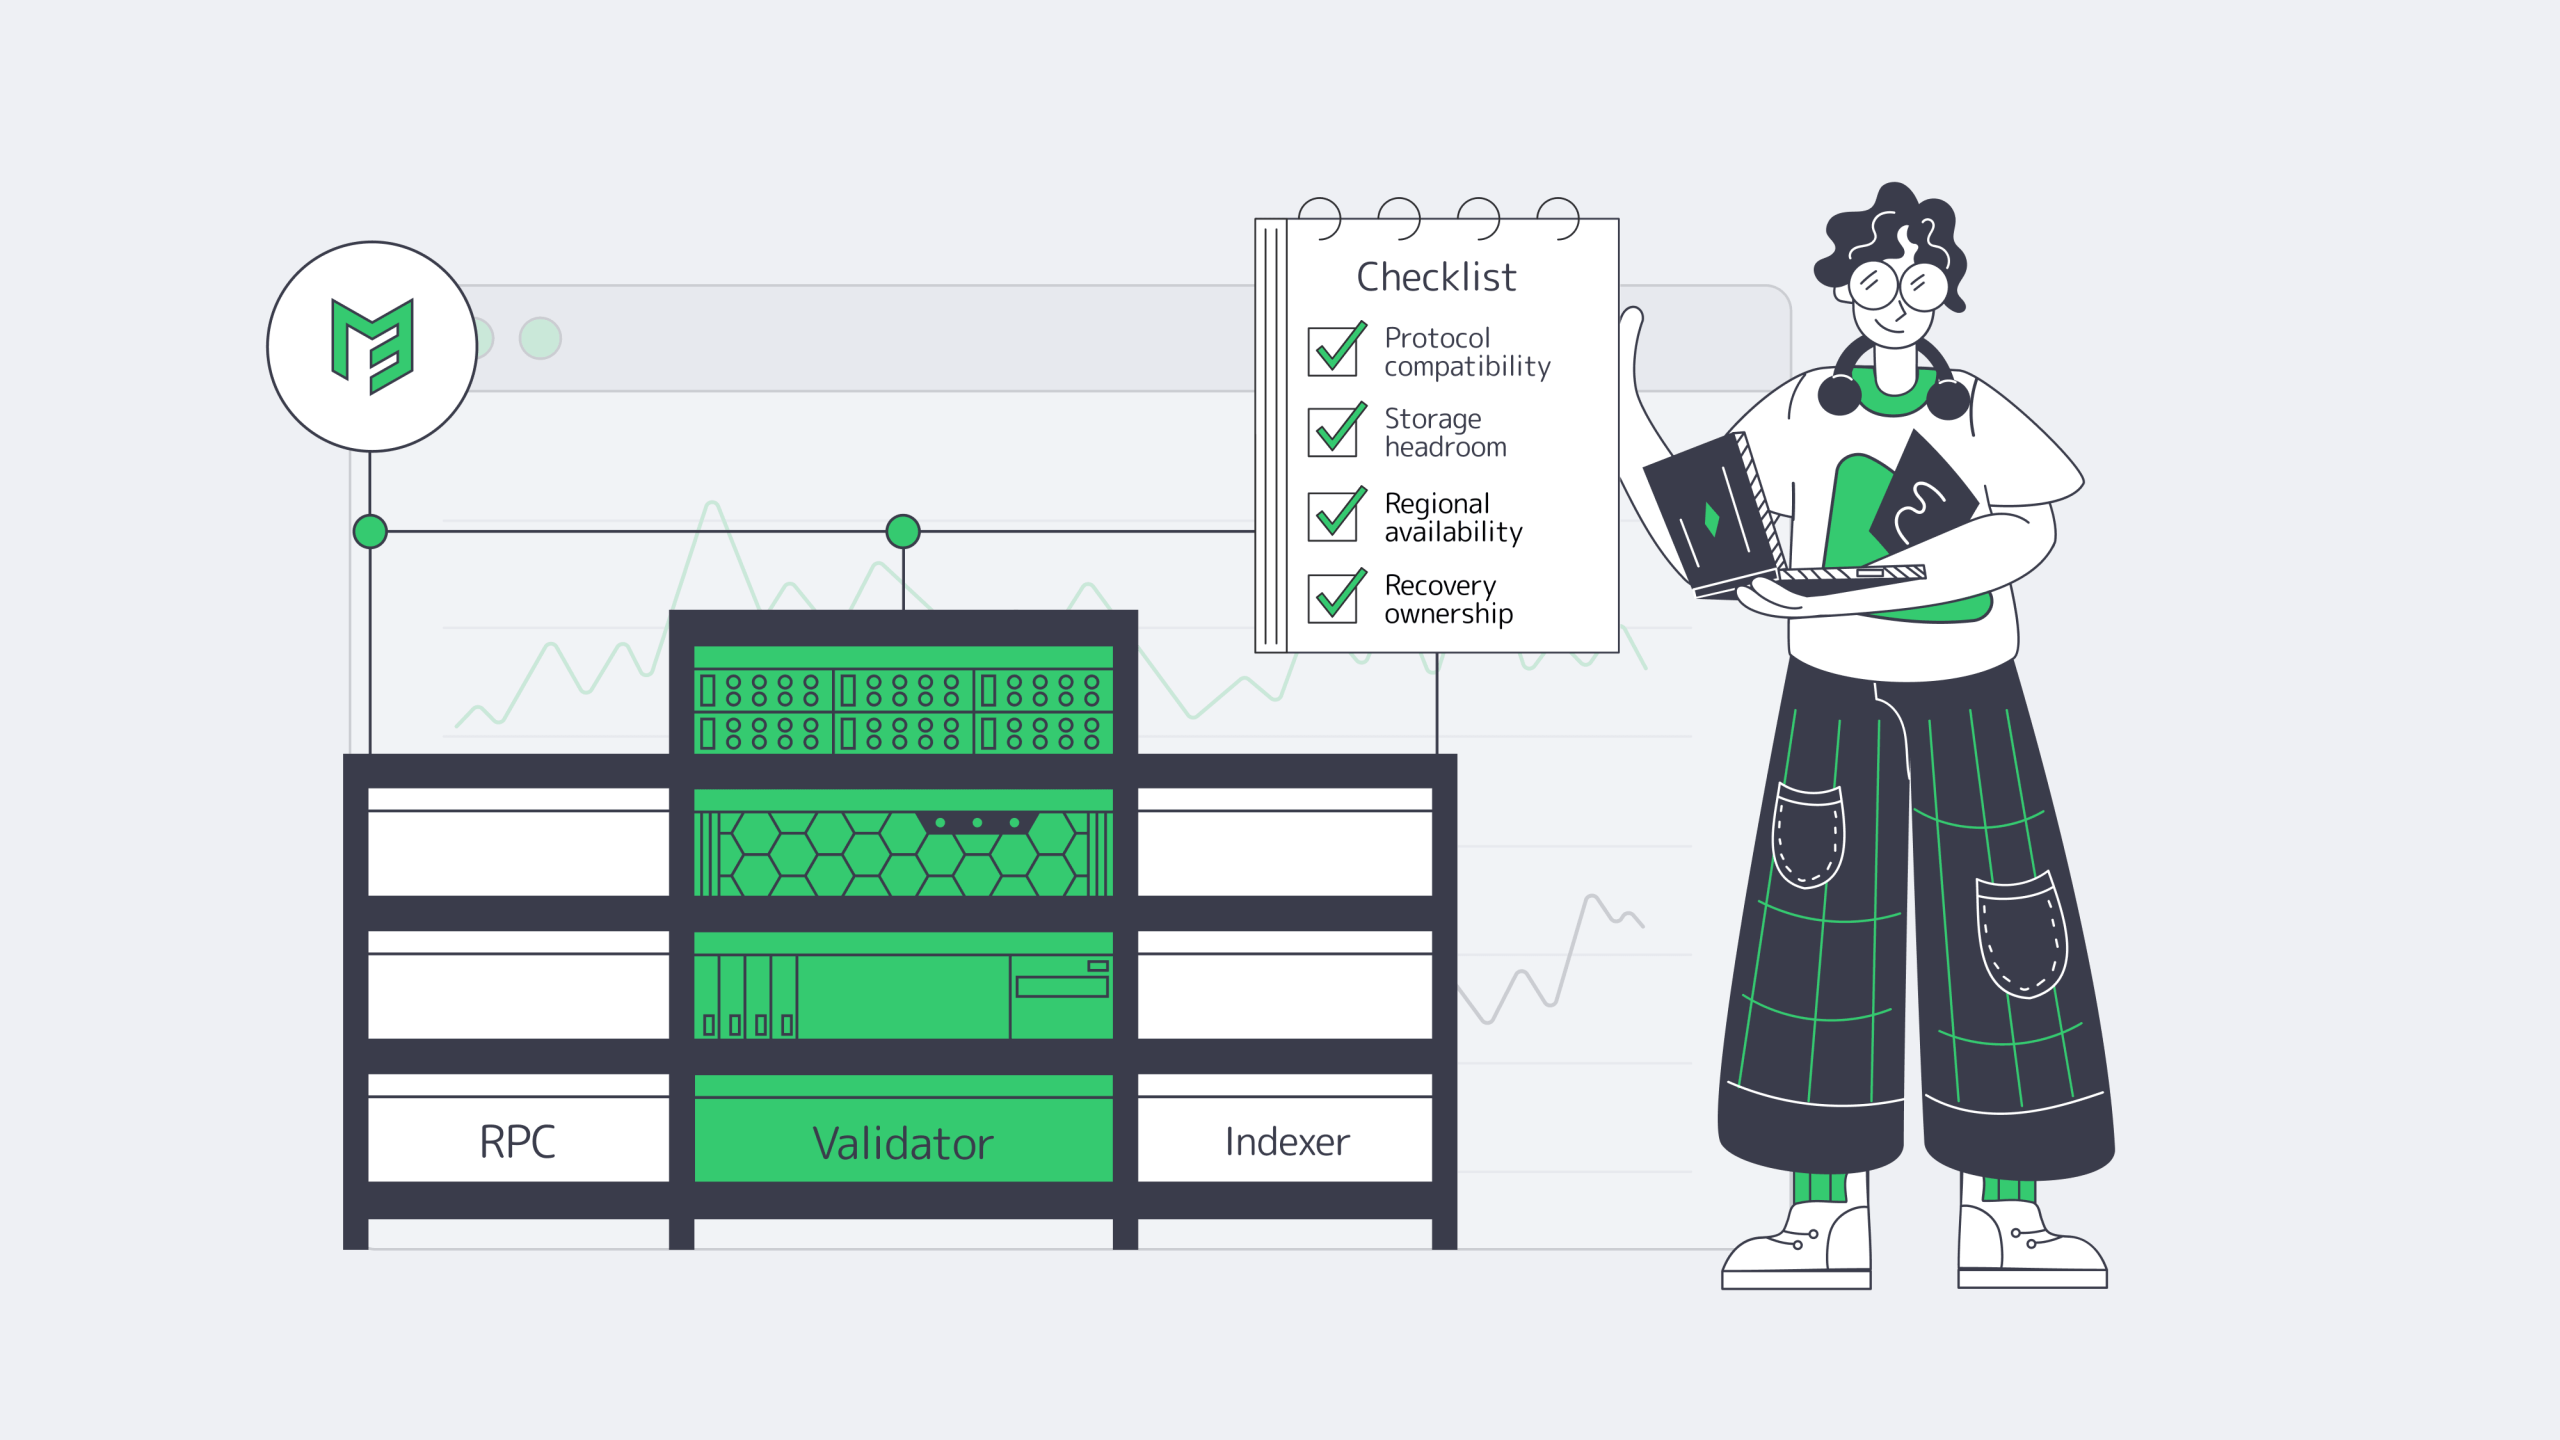
Validators prioritize protocol compliance and safe signing. RPC nodes prioritize endpoint throughput and latency. Indexers prioritize sustained data processing, retention, and reliable rebuilding.
The strongest procurement process combines hardware qualification with explicit operating responsibilities, realistic recovery requirements, verified geographic availability, and workable payment arrangements.
Before committing to production capacity, apply three practical checks:
- Test recovery, not just normal operation. Confirm that validators can resume safely, RPC nodes return to usable synchronization, and indexers restore query-consistent data.
- Validate complete configurations in the target city. CPU, memory, storage, bandwidth, and replacement capacity must be available together.
- Assign operational ownership before deployment. Every critical monitoring, upgrade, backup, failover, and recovery task needs an accountable operator.
These checks turn infrastructure selection into a measurable engineering decision.
Plan Your Web3 Deployment
Use the requirements worksheet to select Melbicom hardware and locations for your validators, RPC nodes, and indexers. Our team can help match each configuration to your workload.
Get expert support with your services
Blog

Choosing a Solana Validator Host: Hardware Replacement, Replay and Failure-Domain Tests
A Solana validator host can look excellent on paper and still fail the test that matters: recovering when something breaks.
Once baseline hardware requirements are satisfied, the procurement question changes. How quickly can a failed storage unit be replaced? Can operators reach the machine when SSH disappears? Can the validator catch up faster than the cluster advances?
Recovery capacity needs to be measured against actual progress on the evaluation cluster, not historical slot-time assumptions. As the Solana Foundation's reduced-slot-time guidance illustrates, slot timing can change, making fixed assumptions unreliable for estimating recovery duration.
Choosing among Solana validator hosting providers requires a written RFP and reproducible acceptance tests—not just specifications.
Dedicated Servers– 1000+ ready-to-go configs – IPMI remote access – 24/7 infrastructure support |
|
Which Operational Commitments Should Solana Validator Hosting Providers Document Before Purchase?
Solana validator hosting providers should document hardware replacement triggers, completion deadlines, covered failures, spare-part availability, management access, and shared infrastructure dependencies. Every replacement commitment needs an observable start and finish. Buyers should reject ambiguous recovery language and require written evidence that the proposed infrastructure supports their recovery objectives.
Define Hardware Replacement Times
“Four-hour replacement” means little without specifying when those four hours begin.
Does the clock start when a ticket opens, when support confirms the fault, or after diagnosis? Does it stop when a component is installed or when the customer can access the repaired machine?
A useful completion criterion requires replacement hardware to be installed, powered, recognized by the system, and accessible through the agreed management interface.
The RFP should distinguish component swaps from whole-server replacements. Replacing an NVMe drive may preserve the surrounding system. Replacing a chassis can change network interfaces, management credentials, and available local state.
Melbicom's Web3 infrastructure includes defective-component replacement within 4 hours and IPMI out-of-band access, supported by 24/7 engineering availability.
Three recovery clocks must remain separate:
Infrastructure recovery: Incident trigger → Usable replacement hardware
Validator recovery: Usable hardware → Validated validator participation
Total interruption: Incident trigger → Validated validator participation
Melbicom's infrastructure support covers server hardware and in-data-center connectivity, while customers retain responsibility for data restoration, resynchronization, validator software, and safe return to participation, unless separately agreed.
Compare Replacement Terms, Management Access and Failure Domains
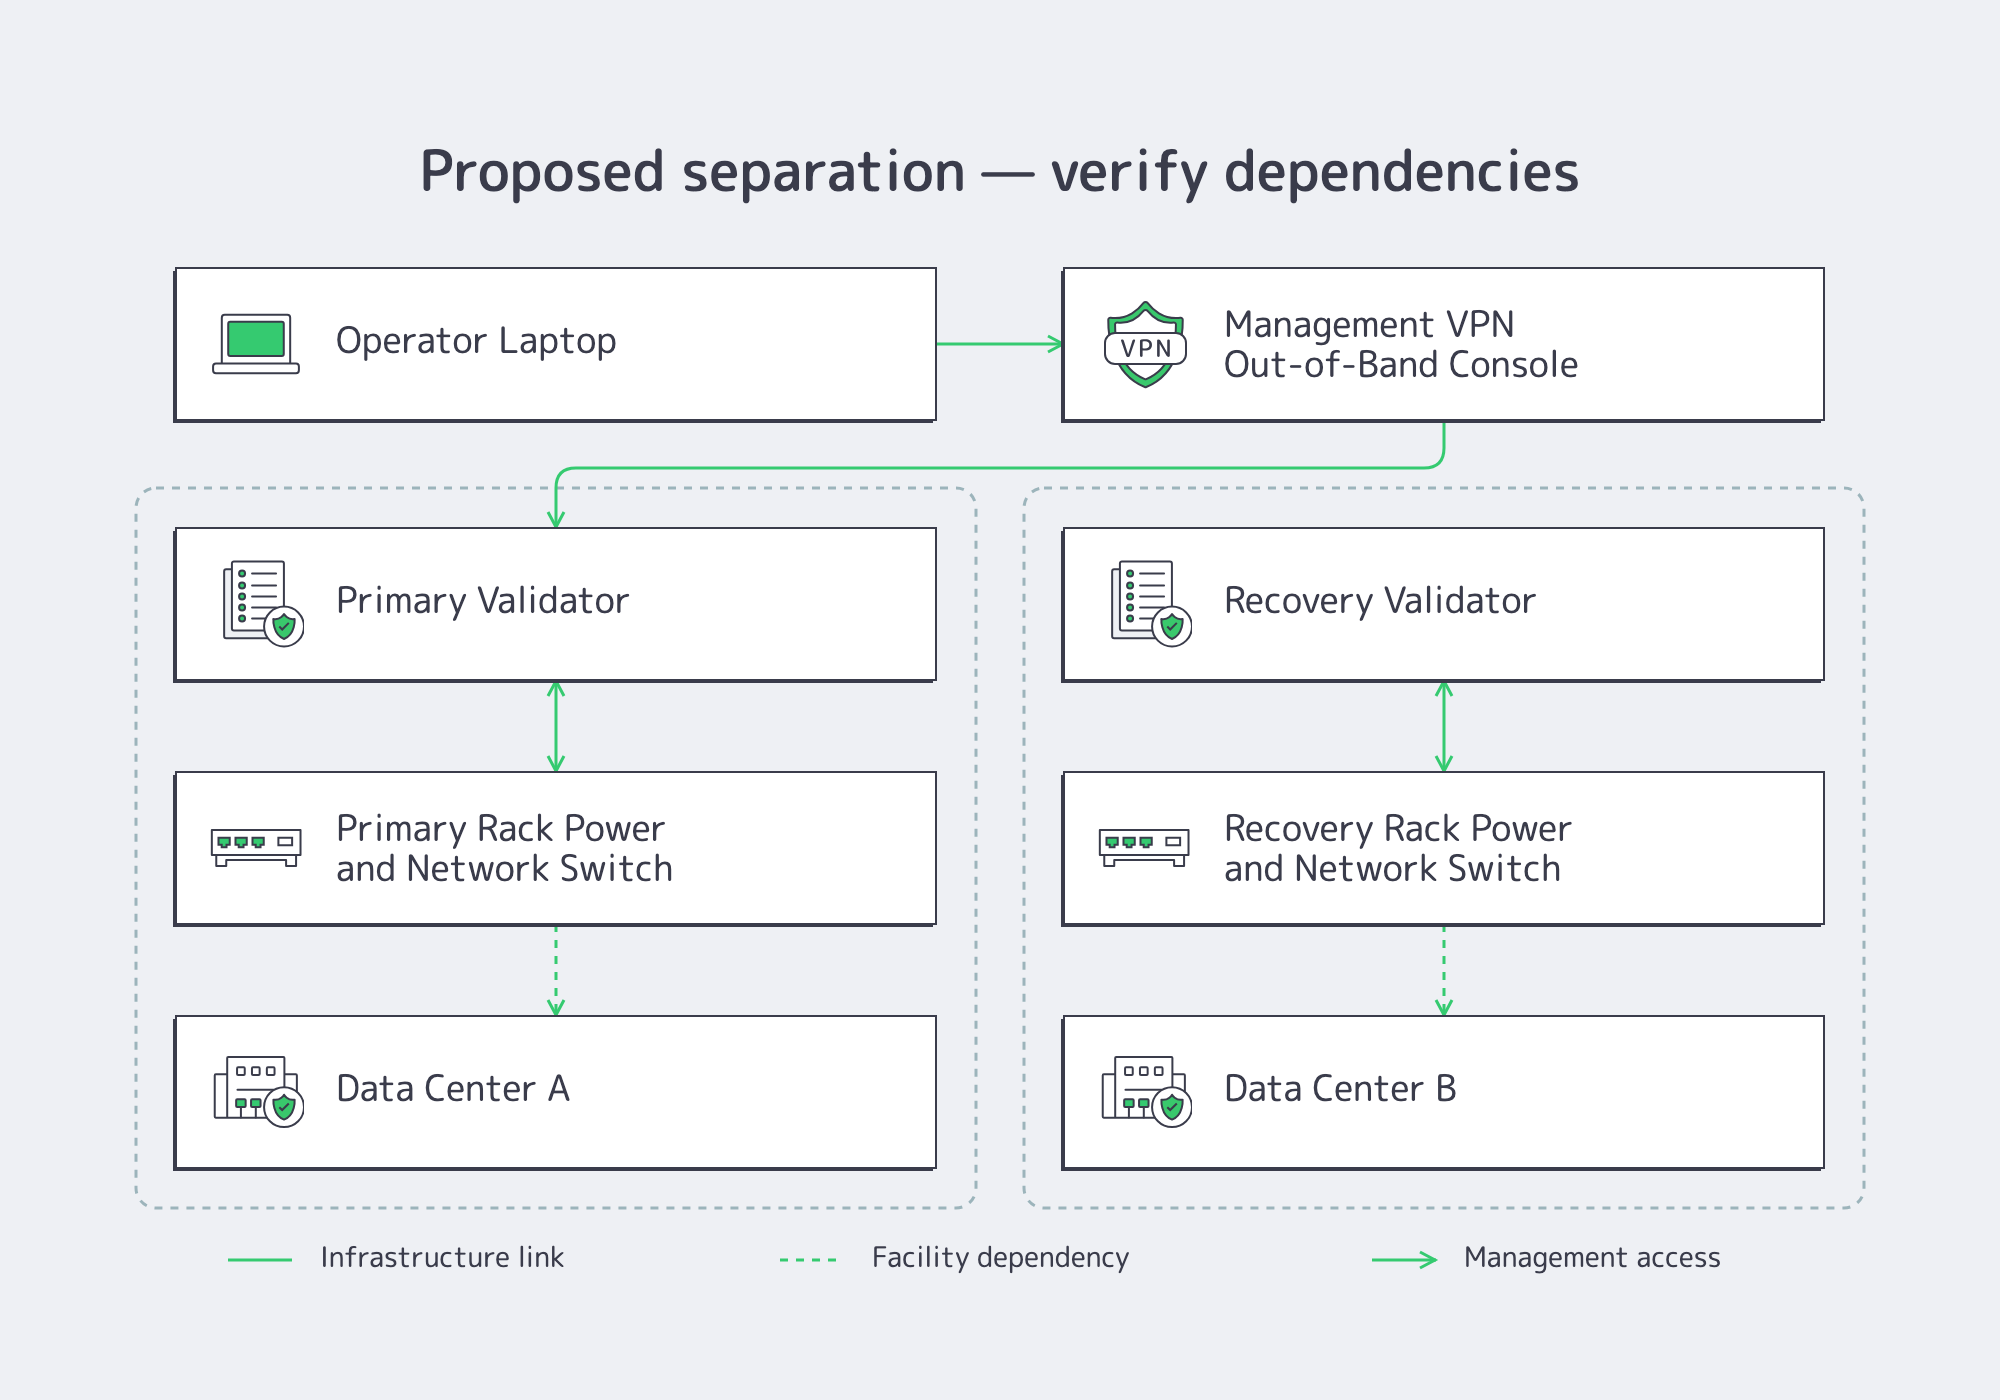
Comparing Solana validator hosting providers requires testing whether operators can regain control after hardware or network failure and whether recovery hosts share critical dependencies. A useful acceptance gate combines documented replacement conditions, functional out-of-band access during simulated host failure, and a dependency map matching the buyer's required rack, facility, or geographic separation.
SSH depends on the installed operating system and production connectivity. A damaged bootloader, broken firewall configuration, or unavailable network interface can eliminate SSH during an incident.
Out-of-band management should remain usable without the host operating system.
Test Management Access Under Failure Conditions
During an authorized maintenance window, establish remote console access, deliberately disable the normal administrative path through a reversible change, and verify that the console remains functional.
The operator should be able to observe boot output, initiate an authorized reboot, and restore access without relying on the installed OS.
Define the acceptable console-access time before testing. The threshold should reflect the operator's outage budget and the time needed for subsequent recovery work.
Melbicom's network architecture includes IP-KVM access through a dedicated control port connected to an isolated management network, accessible through VPN.
The acceptance test for this architecture is concrete: establish the management VPN, interrupt normal host access, verify console continuity, and record timestamps.
Repeat using an independent operator connection where practical.
Validate Hosting Failure Domains
Two servers are not necessarily independent. Separate chassis may share rack power, switching equipment, aggregation infrastructure, or an entire facility. Geographically separated machines can still share management systems or operational dependencies.
NIST SP 800-34 Revision 1 provides contingency guidance on alternate sites and common hazards. Physical separation alone does not eliminate shared dependencies.
The provider should identify shared dependencies across chassis, rack power, switching, facilities, connectivity, and management access.
A rack-level recovery requirement needs separation beyond individual chassis. A facility-outage requirement needs different facilities. Different cities, IP addresses, or autonomous systems alone do not establish complete independence.
Monitoring requires similar discipline. Anza recommends running agave-watchtower on another machine so a validator outage does not simultaneously eliminate monitoring.
Melbicom's data-center locations provide geographic placement options for primary and recovery environments. Operators can select locations according to the failure boundary they need to survive, then document the dependencies of the chosen deployment.
Validate Recovery and Replay Timing After NVMe Loss With Reproducible Tests
A Solana NVMe recovery test should measure how quickly a validator reconstructs valid state, closes its slot backlog, and safely resumes participation. Separate physical replacement, snapshot acquisition, state loading, and catch-up. Use an isolated test identity, synchronized timestamps, and measurable success criteria. A logical storage-loss simulation cannot establish physical replacement performance.
Solana NVMe Recovery Test: Three Scenarios
Anza's validator documentation recommends separating ledger and AccountsDB storage. Recovery therefore depends on which device fails and where snapshots reside.
The acceptance protocol should exercise three scenarios:
- Intact-storage restart: Establish normal startup time as the control, preserving usable local ledger state rather than automatically downloading another snapshot.
- AccountsDB-device loss: Replace the affected test volume while preserving usable state elsewhere, where the deployment's storage topology permits.
- Ledger-device loss: Remove the test ledger and any co-located snapshots, exercising the configured snapshot/bootstrap recovery path.
Use a disposable, non-voting lab instance or an appropriately fenced controlled test with a safe identity and rollback plan. Never wipe a production validator or allow duplicate active voting identities.
A logical disk-loss simulation tests validator recovery, not physical replacement. Measure an actual provider-performed replacement separately when available.
Define Recovery Tests and Success
Freeze the validator client version, executable checksum, consensus mode, kernel, configuration, cluster, snapshot policy, storage paths, and validator arguments.
Record the applicable recovery-state requirements for the selected client and consensus mode. Anza's failover guidance distinguishes Tower BFT tower files from Alpenglow vote-history state; neither recovery procedure should be assumed universal.
Allow normal operation, then impose a controlled outage long enough to create a measurable backlog. Select the outage duration from the recovery scenarios and interruption budget the deployment must tolerate.
During recovery, sample local and reference-cluster slot progression at a predefined interval. The interval should be short enough to reveal sustained stalls and changes in catch-up behavior without relying on isolated, noisy samples.
Catch-up factor = Δ local slots / Δ reference-cluster slots.
This factor measures relative catch-up progress, not pure replay CPU performance.
Compare consistent slot semantics over a stable, monotonic interval after snapshot loading, with a positive denominator. Exclude or flag snapshot jumps, resets, cluster pauses, and discontinuities.
A factor above 1.0 closes lag during that interval. At 1.0, the gap remains approximately unchanged. Below 1.0, it grows.
Set the acceptance criterion using the initial slot backlog, remaining outage budget, and observed net catch-up rate. The validator must advance faster than the reference cluster for long enough to close the backlog within the available recovery window. Evaluate sustained progress and stalls, not just the median factor.
Under approximately steady rates, estimated remaining catch-up time is:
Estimated remaining catch-up time (seconds) ≈ remaining lag (slots) / [local rate − cluster rate] (slots per second).
Both rates must use slots per second, and the net catch-up rate must be positive. This approximation does not predict changing cluster load or future performance.
Record snapshot transfer, loading, ledger processing, and catch-up separately. Keep UTC times for startup, gossip visibility, gap convergence, and validated participation.
Successful recovery requires valid reconstructed state, no unexplained state errors, a closing slot gap, and evidence of safe validator participation. Gossip visibility or a healthy process alone does not prove voting.
Repeat destructive scenarios to assess variation across relevant conditions.
A Solana Validator Acceptance Test
The RFP defines disclosures; acceptance tests measure performance.

The worksheet combines evidence requirements with acceptance criteria derived from the operator's recovery objectives.
| RFP Requirement | Required Evidence | Acceptance Criterion |
|---|---|---|
| Hardware replacement | Written fault scope, clock trigger, completion event, escalation path | Unambiguous terms; physical replacement measured separately |
| NVMe recovery | Storage layout, recovery logs, replacement-media details | Valid state reconstructed and participation safely restored |
| Management access | Console logs and timestamps | Console available within the time allocated for management recovery in the outage budget |
| Catch-up performance | Timestamped local/reference slot samples at predefined resolution | Sustained net-positive catch-up; backlog closes within the allocated recovery window |
| Total recovery | UTC infrastructure and validator timelines | Within the operator's defined outage budget |
| Failure domains | Written shared-dependency declaration | Separation matches the specified outage scenario |
| Monitoring | External observer records | Monitoring survives the tested host outage |
| Reproducibility | Configuration hashes, logs, test records | Independent engineer can repeat the procedure under the defined conditions |
The test plan should specify outage duration, measurement resolution, recovery-stage time allocations, and relevant operating conditions before execution. These inputs make results comparable and tie acceptance to operational needs.
Preserve the Complete Evidence Package
Collect validator logs, service-manager logs, kernel events, device inventories, mount states, configuration checksums, catch-up observations, external cluster measurements, and provider ticket timestamps.
Use the measurement commands and metric definitions supported by the pinned client version. Anza's operational guidance emphasizes preserving usable local state and verifying catch-up rather than treating every restart as a fresh bootstrap.
Report recovery durations using synchronized timestamps:
T_infrastructure = t_usable_hardware – t_incident
T_validator = t_validated_participation – t_usable_hardware
T_total = t_validated_participation – t_incident
For these contiguous definitions, T_total = T_infrastructure + T_validator.
Break validator recovery into snapshot acquisition, state loading, ledger processing, catch-up, and participation validation. Report observed overlap rather than assuming stages are independent or strictly sequential.
Include the maximum observed slot gap, catch-up factors, and individual run durations.
Use the same workload and measurement method for each offer. Snapshot sources and cluster conditions can vary, so record those differences rather than attributing every timing change to host performance.
A provider support drill should use a prearranged ticket, not a fabricated emergency.
Separating Contractual Commitments From Observed Trial Results
A successful trial is evidence of performance under particular conditions. It is not a contractual promise.
Keep three evidence categories distinct.
Written commitments establish what the provider has agreed to deliver, including applicable hardware replacement conditions.
Observed results establish what happened on a specific configuration, date, and workload.
Architecture evidence identifies dependencies that cannot safely be tested through deliberate facility, power, or network disruption.
A three-hour observed replacement does not redefine a written four-hour commitment. Likewise, documented management-network isolation does not replace a successful console-access test.
Every evaluation record should identify the configuration, date, location, failure scenario, predefined thresholds, measurements, anomalies, and evidence classification.
For a small number of trials, report individual durations, the observed median, or the observed maximum. Do not present an unsupported p95, statistically reliable worst-case estimate, or guaranteed future recovery time.
Choosing a Solana Validator Host Means Buying a Recovery Envelope
The strongest hosting decision rests on reproducible evidence, not a benchmark alone.

Before approving a provider, apply these operational decision rules:
- Reject undefined recovery clocks. Written hardware replacement terms should identify exactly when responsibility begins and when usable infrastructure is returned.
- Prioritize controllability during failure. Test management access with normal host connectivity unavailable, not only during healthy operation.
- Separate recovery bottlenecks. A slow snapshot transfer, slow state load, and inadequate catch-up headroom require different responses.
- Match redundancy to the intended outage. Independent chassis cannot satisfy a facility-level recovery requirement.
- Preserve evidence categories. A successful trial, architectural declaration, and written commitment answer different procurement questions.
Once baseline specifications are adequate, operational recoverability becomes the deciding factor. A host must remain controllable during failure, support predictable infrastructure restoration, and provide sufficient measured catch-up capacity to return the validator safely to participation.
Plan Your Solana Deployment
Use these replacement terms, management-access requirements, recovery tests, and failure-domain criteria to choose a Melbicom dedicated server and location for your validator.
Get expert support with your services
Blog

iGaming Hosting Providers: Compare Written Acceptance, Locations and Operating Responsibilities
“Does this host allow gambling?” is the wrong question to start an infrastructure purchase. Acceptance depends on the operator, specific workload, player markets, server location, traffic characteristics, and division of operational responsibilities.
A provider may accept casino applications while requiring prior consent for streaming or other high-load services. A server may be available in the requested city without that location satisfying the operator's regulatory obligations. And 24/7 infrastructure support does not mean the provider operates the gambling application.
Three decisions must remain separate: Will the provider accept the workload? Is the proposed location suitable? Who operates what after deployment?
iGaming Servers– 1000+ ready-to-go configs – Custom server builds – 24/7 infrastructure support |
|
Which iGaming Dedicated Hosting Providers Confirm Workload and Jurisdiction Acceptance in Writing?
iGaming dedicated hosting providers should confirm acceptance for the specific contracting entity, gambling workload, player markets, and server city. Procurement should describe the intended deployment, identify any activities requiring prior consent, and obtain written clarification of unresolved conditions. The resulting acceptance record should be attached to the order before production deployment is approved.
Melbicom's hosting offering supports gambling workloads. Edge and unusual workloads or deployment conditions can be discussed with our team through our iGaming hosting service.
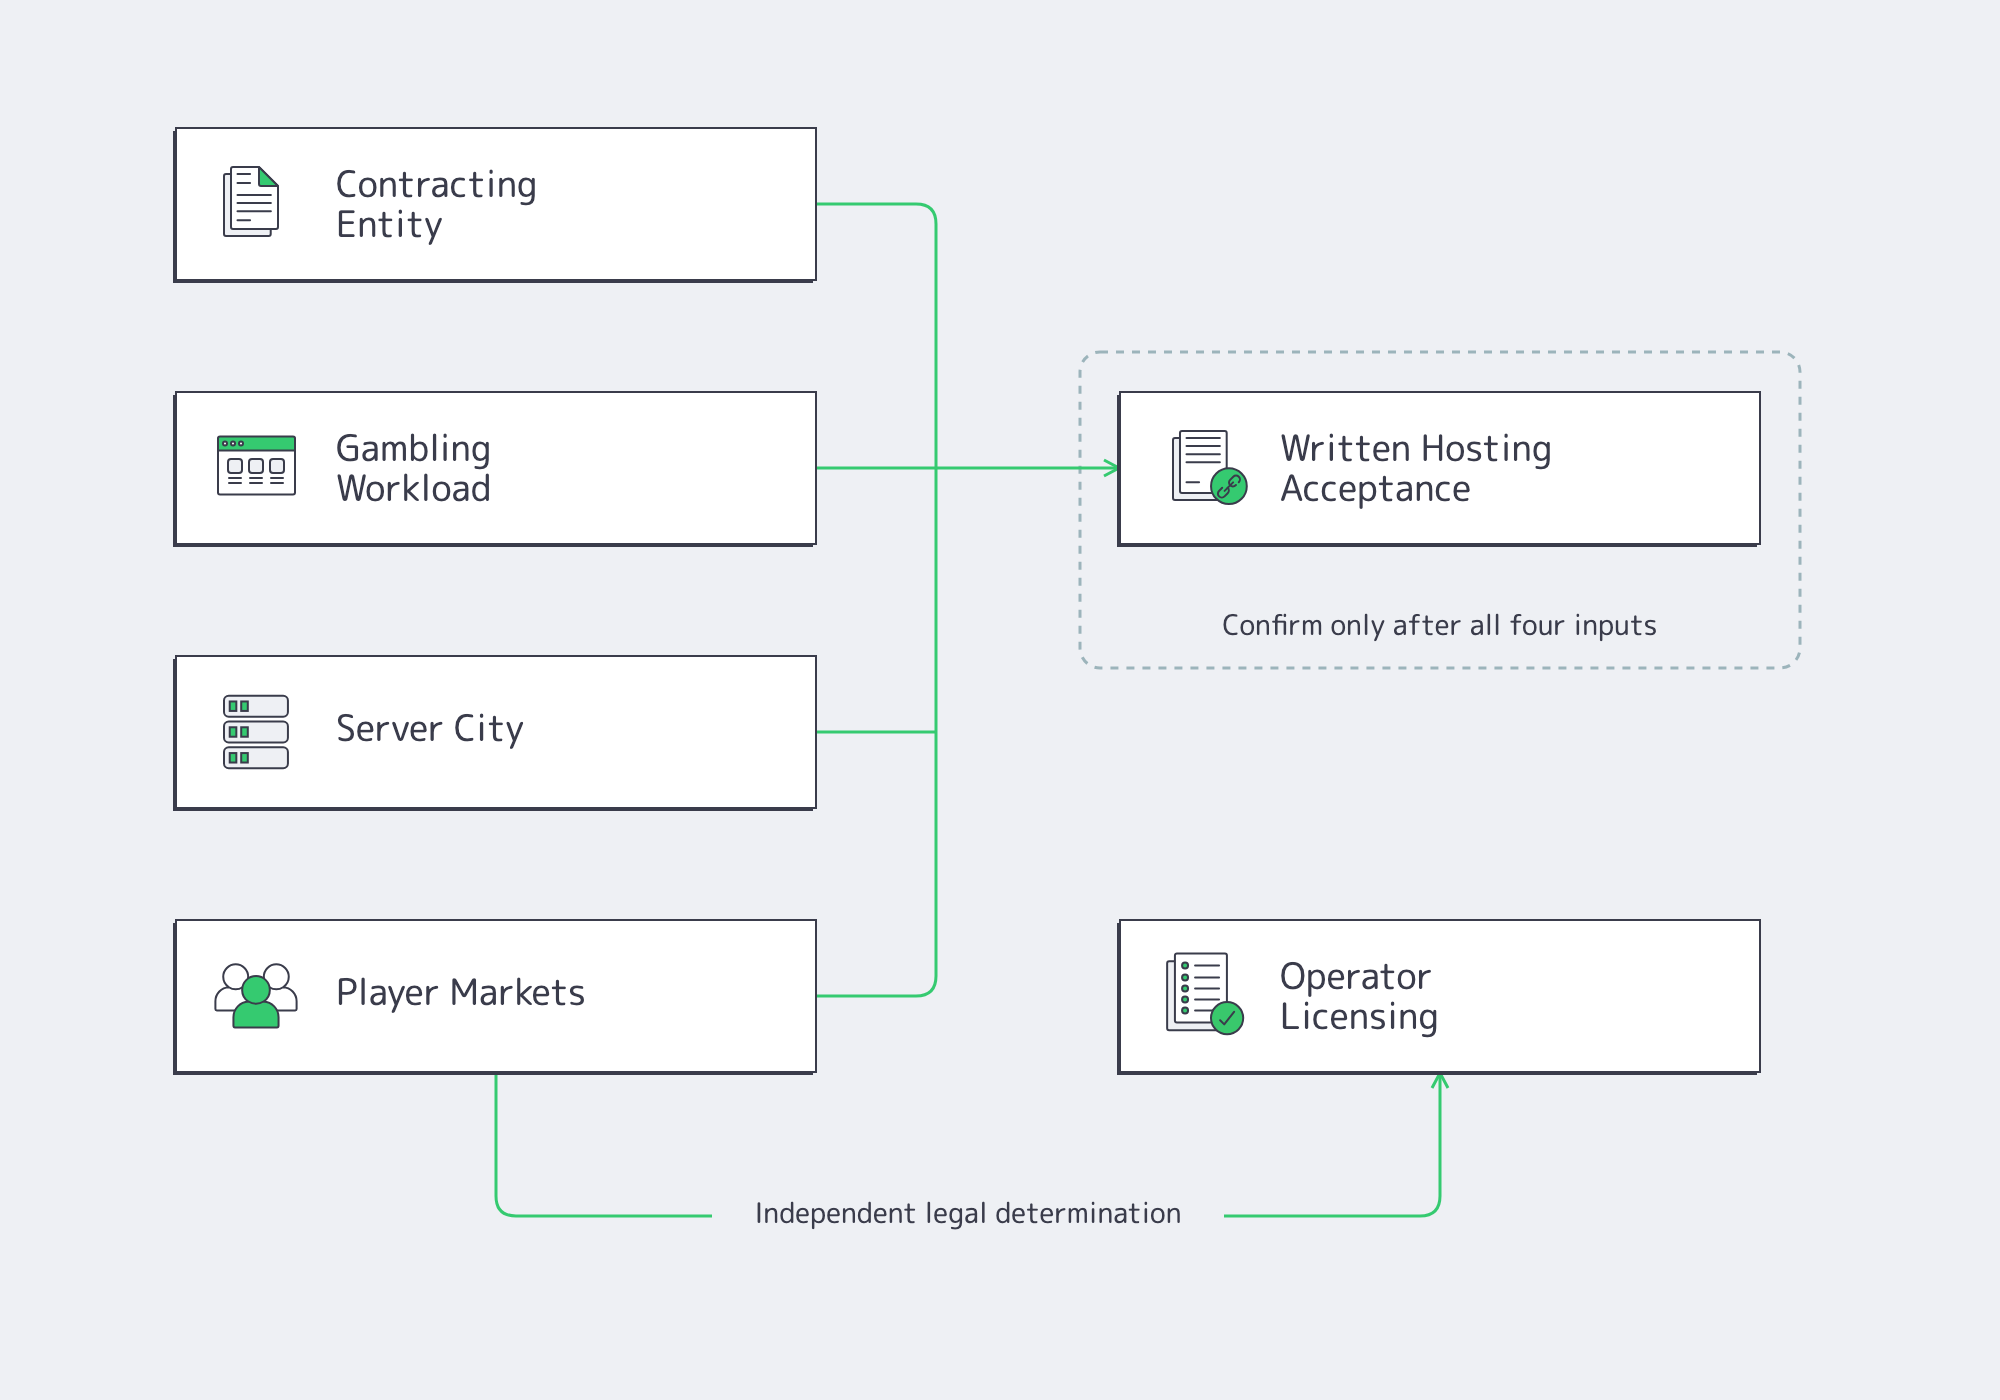
A useful acceptance record identifies four coordinates:
Contracting entity × workload × player market × server city.
Describe sportsbook APIs, casino services, wallet transactions, odds processing, databases, or streaming components individually rather than requesting approval for “gaming.”
Attach the provider's written response to the quotation, support ticket, or purchase record, including any conditions affecting the intended deployment.
iGaming Hosting and Operator Licensing
Infrastructure availability does not establish legal eligibility.
The European Commission confirms that online gambling is not governed by a single harmonized EU regulatory framework.
Legal teams establish operator eligibility and equipment-placement requirements. Procurement verifies whether the hosting provider accepts the resulting deployment.
Hosting acceptance does not replace operator licensing obligations.
Compare Acceptable Use Restrictions, Support Scope, and Operator Duties
Comparing acceptable use restrictions, infrastructure support, and operator responsibilities requires checking the current service agreement against the proposed deployment. Procurement should identify prohibited or consent-dependent workloads, distinguish hardware and network support from application operations, and assign backup, recovery, and escalation ownership. Unresolved conditions remain approval blockers until documented in writing.
The following procurement questionnaire turns those requirements into decisions.
| Procurement Question | Evidence Required | Approval Criterion |
|---|---|---|
| Is the exact gambling workload accepted? | Workload description and provider response | Intended production services covered |
| Is the requested server city suitable and available? | Location availability, operator placement requirements, provider response | Location accepted and operator requirements satisfied |
| Are intended player markets addressed? | Operator legal determination and provider acceptance | Both independently established |
| Does traffic require prior consent? | Sustained and peak traffic, service description, applicable terms | Required authorization obtained |
| Who handles hardware and network faults? | Service agreement and support scope | Provider responsibilities documented |
| Who operates software and applications? | Standard support scope and any separately agreed services | Customer ownership or exception explicit |
| Who handles backups and restoration? | Service agreement and recovery plan | Recovery owner and procedure documented |
| How are incidents escalated? | Support channels and internal contacts | Routes assigned before launch |
| Who handles policy notices? | Agreement and account-notification process | Named customer owner assigned |
Melbicom's Public Services Agreement establishes the acceptable-use conditions, support boundaries, and customer responsibilities needed to complete this worksheet.
Acceptance and jurisdiction questions are pass/fail gates. Hardware performance cannot compensate for an unresolved authorization condition.
iGaming Hosting Workload Acceptance and the Gambling Hosting Acceptable Use Policy
Melbicom's Public Services Agreement prohibits unlawful activity, spam, certain abusive network behavior, and third-party-rights violations. Some high-load services, including streaming, file sharing, and storage distribution, may require prior consent.
This matters when a gambling platform combines transaction APIs with live-media delivery or high-volume replication. Acceptance of the casino application does not automatically cover every supporting service.
For components requiring prior consent, provide sustained and peak traffic estimates, protocols, anticipated concurrency, and whether the service is player-facing or internal. Include these details in the acceptance request before ordering.
Selecting a Suitable Server City
Location selection involves three checks: operator eligibility, provider acceptance, and technical suitability.
The relevant question is whether the specified operator's workload can run in the selected city while serving its declared player markets.
Technical suitability depends on the application's connections to player networks, payment systems, gaming suppliers, and dependent APIs. Measure routes to these endpoints rather than selecting a city solely by geographic proximity.
Melbicom offers dedicated servers in 21 data centers. Per-server network options range from 1 Gbps to 200 Gbps, depending on location.
Verify Workload Conditions and Escalation Paths Before Approval
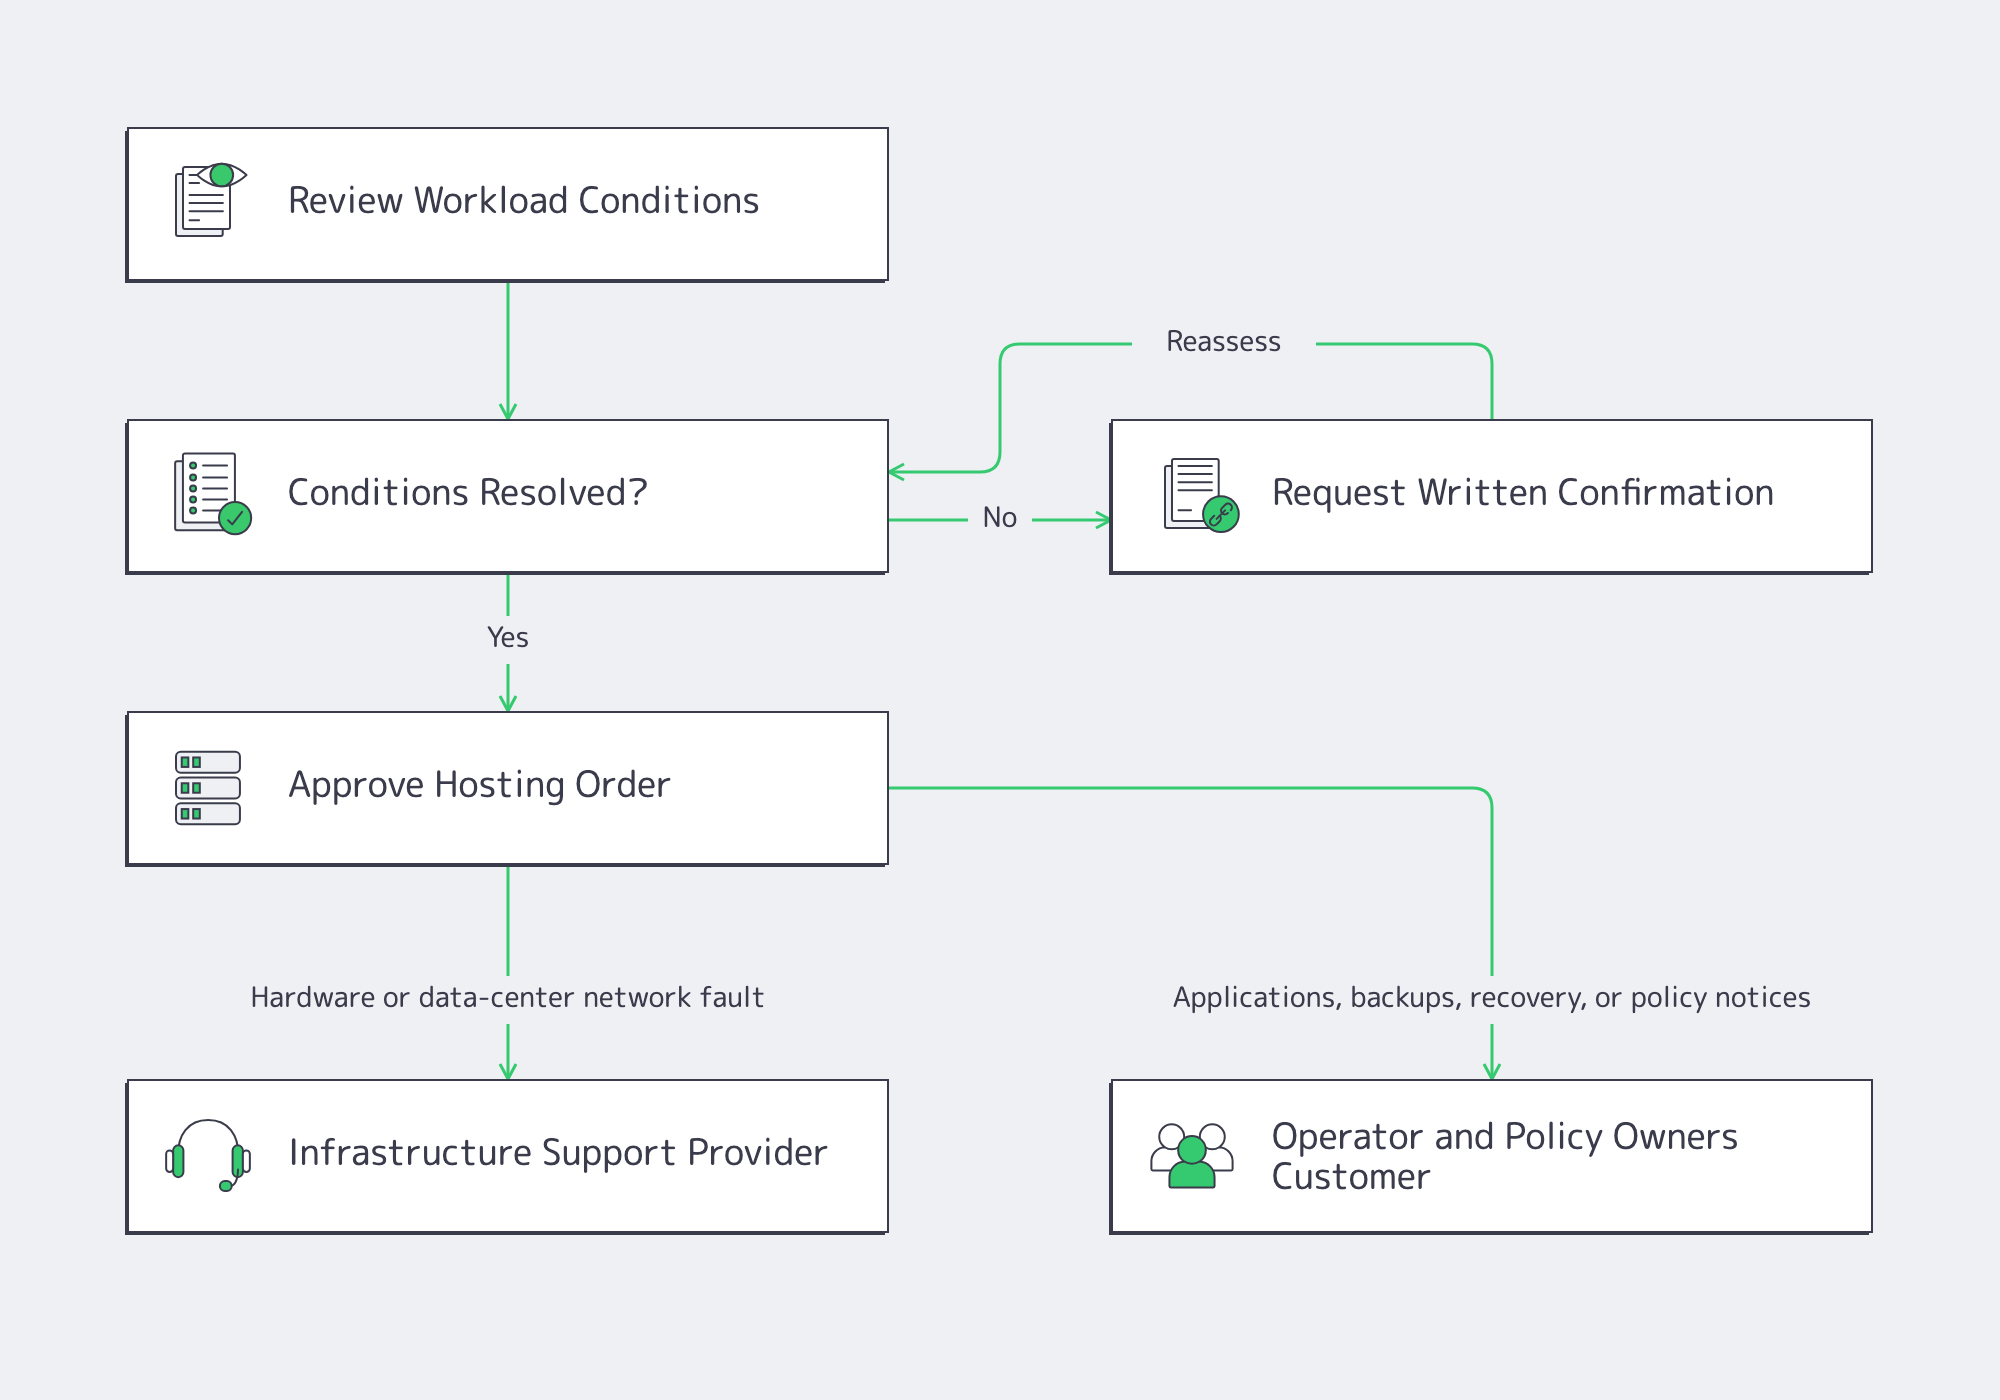
Before approving an iGaming hosting provider, establish who handles infrastructure faults, application incidents, data recovery, and policy notices. Document any support tasks outside the standard service scope and assign internal escalation owners. The objective is an operating model that can be used during production incidents, not simply a completed purchasing checklist.
iGaming Support: Who Operates What?
Melbicom's standard technical support covers server hardware operation and network connectivity within the data center, as defined in our Public Services Agreement.
Customer-installed software falls outside that default scope unless separately agreed. Customers are responsible for maintaining backups and recovering their data.
A failed physical component or data-center connectivity problem therefore belongs on our infrastructure support path. Database failures, wallet integration problems, application deployment errors, and data restoration remain customer responsibilities unless additional services are expressly arranged.
Melbicom provides 24/7 support channels, including tickets, email, and other contact methods. Our infrastructure assistance includes server reboots, OS reinstalls, BGP setup, and network troubleshooting.
We also provide defective-component replacement within 4 hours. The recovery plan should account separately for restoring applications and customer data after hardware service is completed.
If specialized configuration, ongoing software maintenance, or custom recovery assistance is required, define those tasks through a separate agreement.
Escalation Paths Must Distinguish Technical Incidents From Policy Notices
Melbicom maintains separate contact channels for technical support, commercial inquiries, and abuse reports.
A routing failure should not follow the same process as a policy warning.
Our agreement permits suspension or termination under specified circumstances, including prohibited activity and threats to network stability. Advance notice depends on the circumstances, and immediate action may be taken where necessary. Notices and reasons may be communicated through the customer account.
The operator should assign separate owners for infrastructure incidents and policy notices. Technical reports should include timestamps, server identifiers, and network diagnostics. Account notices must reach someone authorized to review and respond.
A Procurement Acceptance Framework for iGaming Dedicated Hosting Providers
Use a two-stage purchasing decision.
First, establish operator eligibility and provider acceptance for the intended workload, player markets, and server city. Resolve any required prior consent or other material acceptance conditions before ordering.
Second, assess technical fit: server configuration, per-server network requirements, measured latency, availability, and operational responsibilities.
Provisioning also affects launch planning. Melbicom offers iGaming dedicated hosting with two-hour activation for ready configurations and custom builds within 3–5 days. Our team can help align configuration and delivery with your launch schedule.
The final procurement record should establish:
- Workload: Document accepted production services and any required prior consent.
- Location: Establish placement eligibility, provider acceptance, and technical suitability.
- Jurisdiction: Keep operator licensing decisions separate from hosting approval.
- Responsibilities: Assign infrastructure, application, backup, and recovery ownership, including separately agreed exceptions.
- Escalation: Identify technical and policy-notice contacts and ensure the responsible teams receive notifications.
The Final Hosting Approval Gate
The decisive distinction is between a provider offering gambling hosting and accepting a specific production deployment under understood operating conditions.

An accepted workload, a suitable server city, and a valid operating license answer different questions. Procurement must resolve all three while keeping infrastructure support, application operations, and recovery ownership explicit.
Explore Melbicom iGaming Hosting
Melbicom’s dedicated hosting team can help match your gambling workload and location requirements to an appropriate server configuration and address acceptance conditions before ordering.
Get expert support with your services
Blog

Dedicated Servers in Spain: A Buyer’s Guide to Location, Network and Workload Fit
Searching for a dedicated server in Spain gives you a country filter. Production infrastructure requires more: a verified physical location, measurable routes to Spanish users, hardware matched to actual workloads, and acceptance criteria that can disqualify an unsuitable offer.
According to CNMC’s June 2026 report, 91% of Spain’s fixed-broadband lines used fiber-to-the-home at the end of 2025. Even with fast access, congestion, routing changes, and application bottlenecks can slow responses. Server selection therefore needs to account for the paths to Spanish users and the application’s behavior under load.
The buying question is straightforward: Will this specific Spanish deployment meet the performance requirements of the users and applications it must serve?
Servers in Spain– 90+ ready-to-go configs – Tier III DC in Madrid – Metered and unmetered traffic |
|
Which Requirements Should Guide Dedicated Server Selection in Spain?
Dedicated server selection in Spain should follow four acceptance gates: verified physical location, measured routes to priority user networks, hardware performance under realistic peak workloads, and operational readiness. Each candidate should satisfy predefined latency, capacity, and deployment requirements. Reject configurations that cannot demonstrate acceptable performance before production cutover.
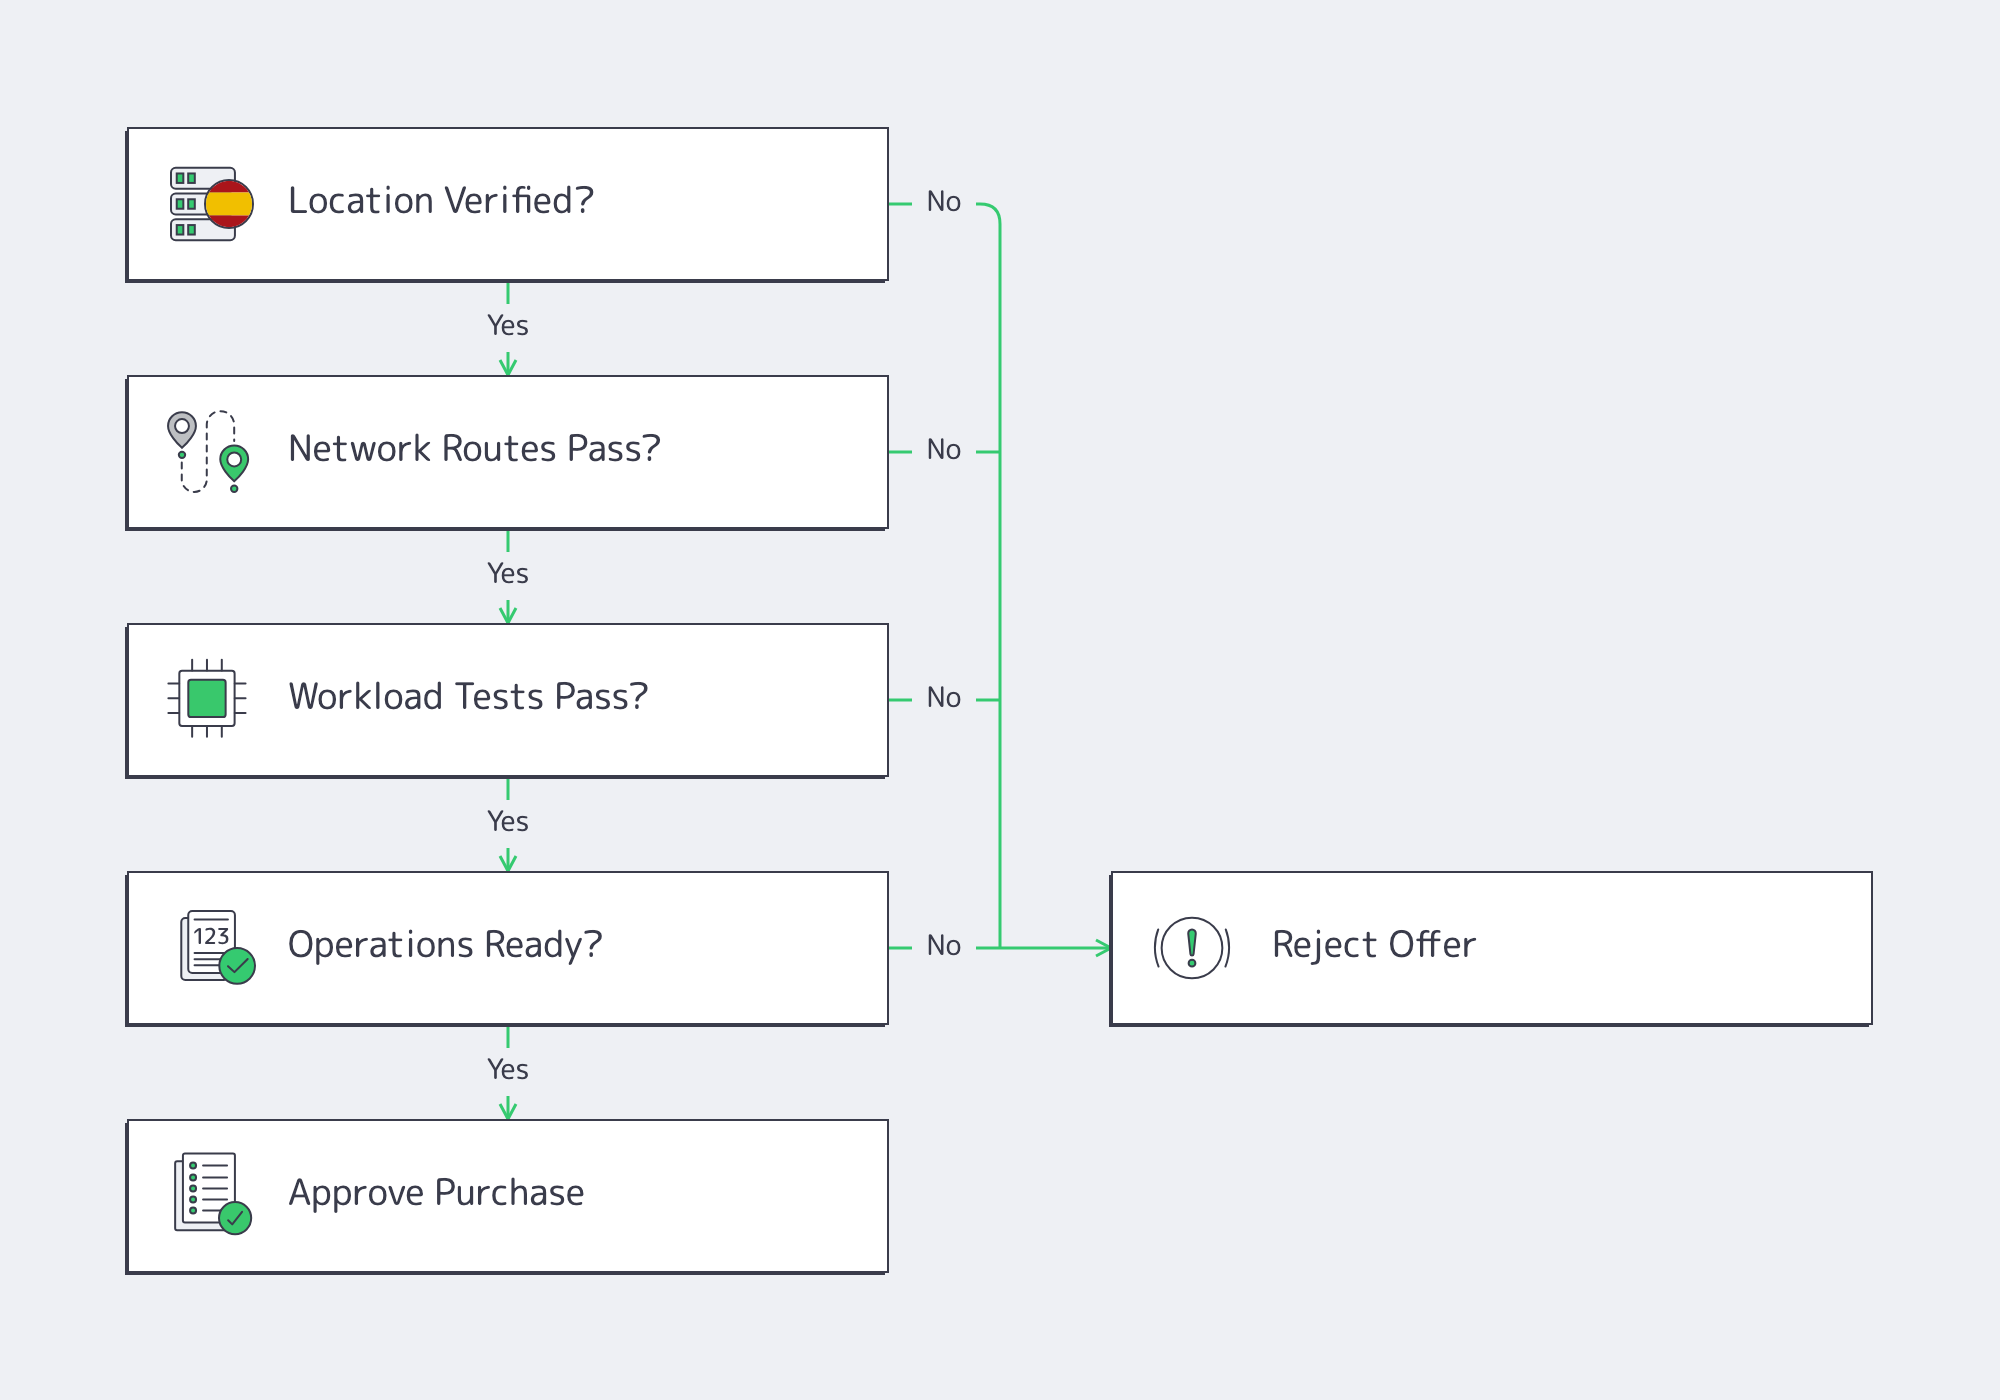
Four Acceptance Gates
Location. Verify the actual hosting city rather than accepting a generic country label. Confirm that the ordered server, pre-sales test endpoint, and provisioned machine correspond to the intended metro.
Network. Measure routes from the access networks carrying your users. Two servers in Madrid can produce different latency distributions because of transit, peering, congestion, and return-path differences.
Workload. Define success through application outcomes: requests per second within a p99 latency budget, database transactions without I/O stalls, or batch jobs completed within their processing window. Google’s SRE guidance emphasizes high-percentile latency because averages conceal performance degradation.
Operations. Confirm inventory, provisioning windows, support access, and recovery procedures. Establish who handles hardware failures, software administration, backups, and restoration, and ensure the deployment schedule accommodates the required operational checks.
Start with a measurable requirement: “The production API must handle forecast peak traffic plus a defined growth and burst margin while maintaining its existing p99 response-time objective.” That statement determines what to test and prevents procurement from becoming a comparison of impressive specifications.
Location, Network and Workload Fit
Compare a confirmed physical city with timestamped measurements from priority user networks, then test candidate hardware against the application’s peak workload and latency objectives. A location label, exchange membership, or specification sheet cannot prove production fit. Approve only when the ordered deployment and its measured behavior meet your documented acceptance criteria.
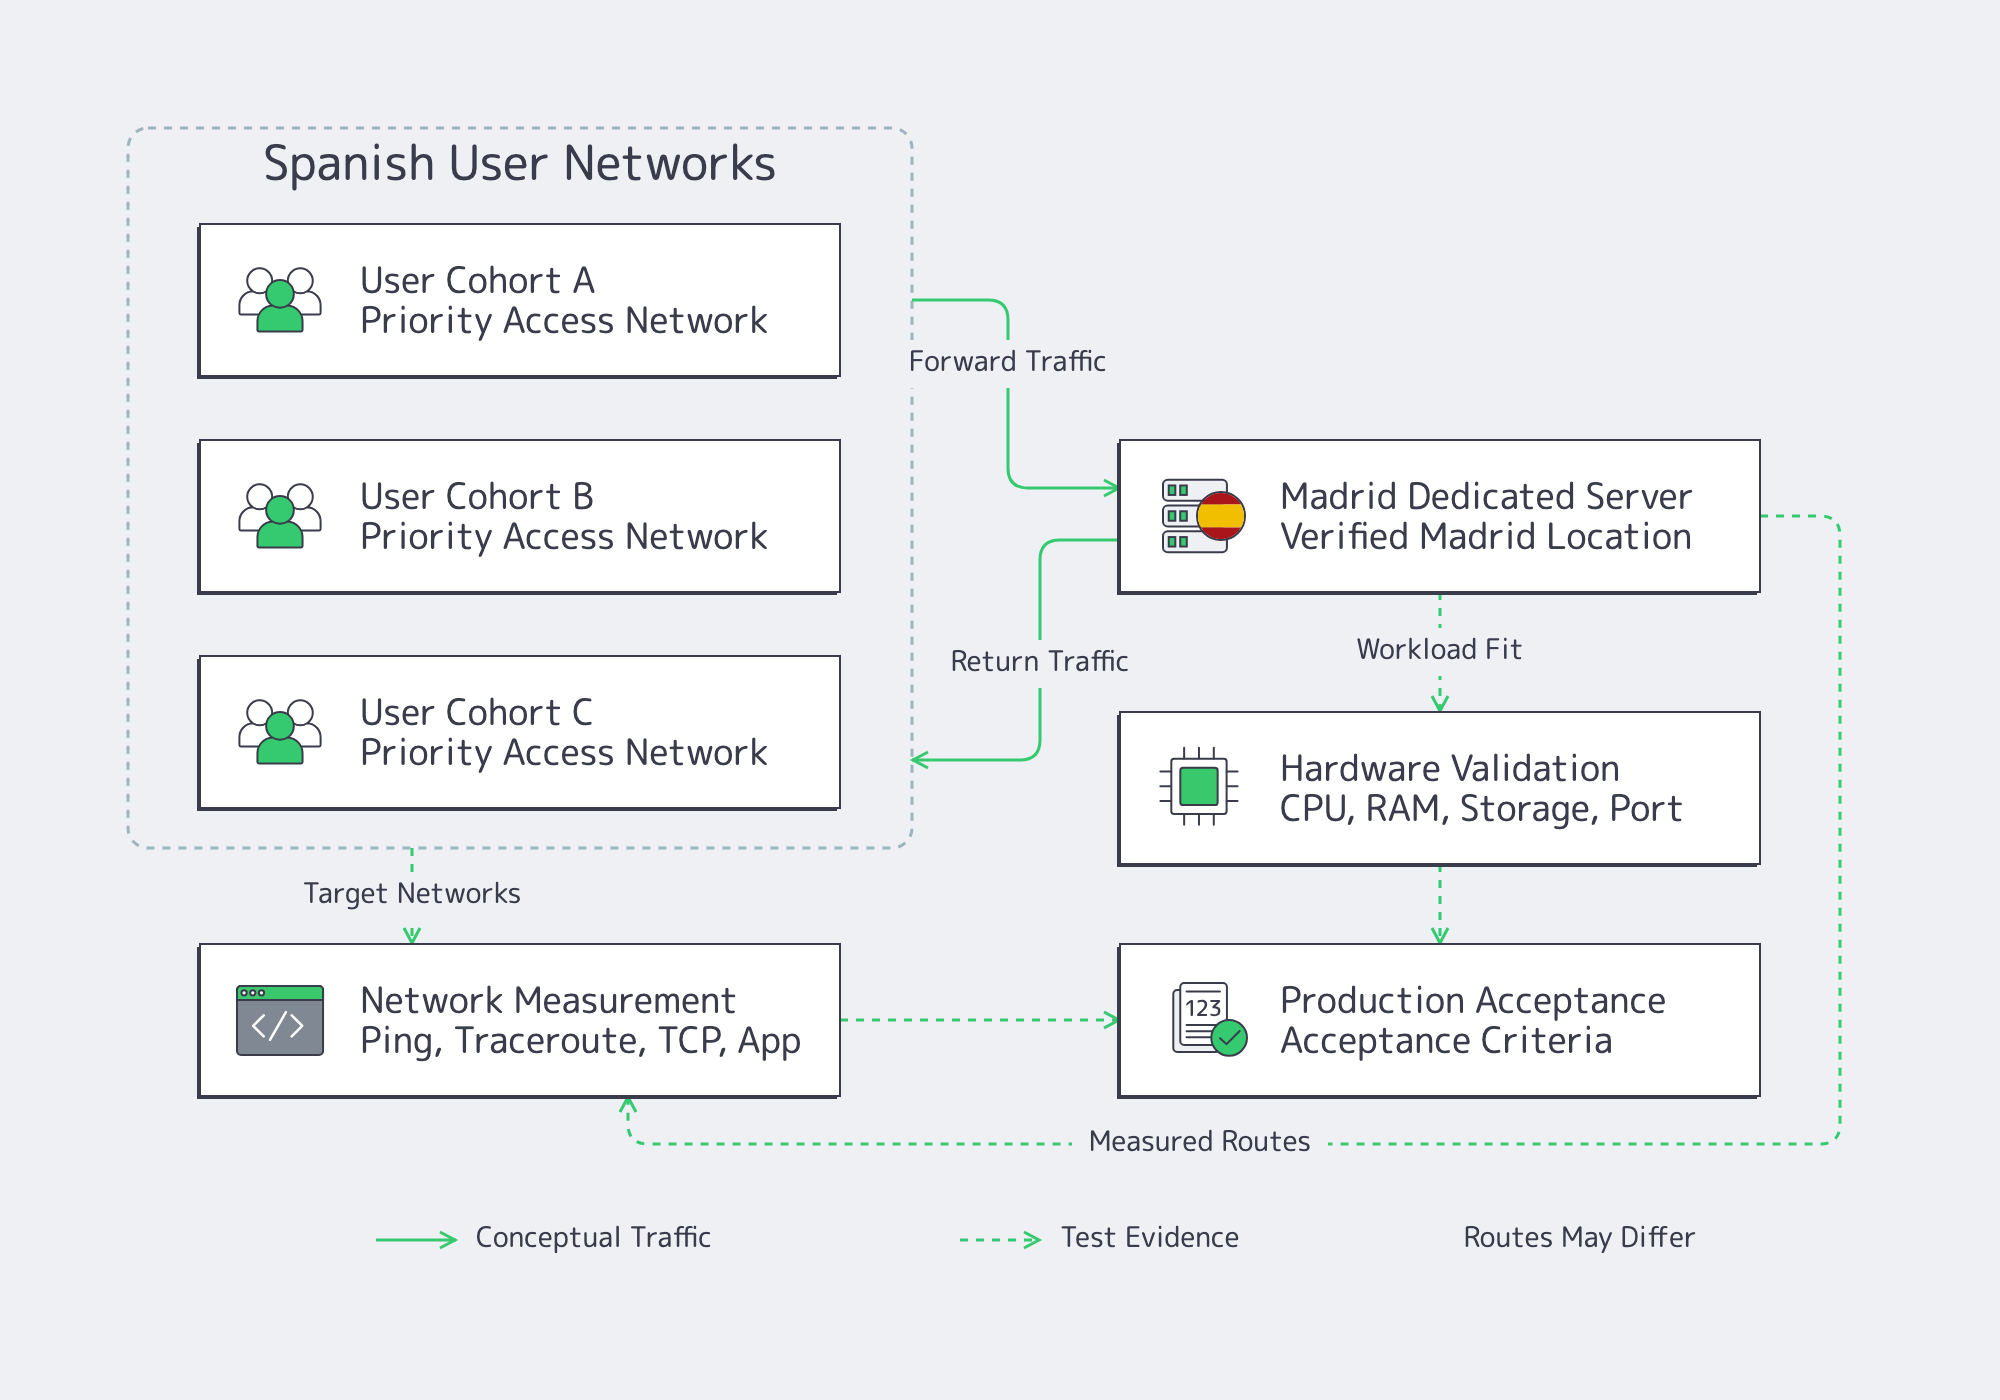
Madrid is a substantial interconnection market, making it a practical location to evaluate for applications serving Spanish users. The relevant question is how a specific deployment reaches the networks carrying those users, particularly during busy periods.
Spanish Server Network Evaluation: Test the Networks That Matter
Actual traffic paths depend on routing arrangements, so network evaluation should measure the routes used by the intended application. Shared exchange presence creates opportunities for local interconnection, but route measurements establish how traffic actually travels.
Build a test population from application logs. Map client IP addresses to autonomous systems and prioritize networks carrying most of your Spanish traffic, then include networks serving business-critical customers.
When internal telemetry is unavailable, national market data offers a starting point. CNMC reported that four major operator groups represented 93.7% of Spanish fixed-broadband lines in December 2025.
Use RIPE Atlas for recurring ping and traceroute tests from target networks. Collect p50, p95, and p99 RTT, packet loss, and IPv4/IPv6 behavior across busy and quiet periods.
Document probe locations, sampling intervals, sample counts, aggregation methods, and measurement windows. High-percentile results are meaningful only when the sample population and methodology are sufficiently representative.
Measure TCP connection time, TLS negotiation, time to first byte, and application response latency separately. ICMP measurements cannot expose application queueing, and traceroute cannot establish route symmetry.
For throughput, iperf3 supports controlled tests. Use adequately provisioned endpoints, multiple flows where appropriate, and CPU monitoring to distinguish network limitations from endpoint bottlenecks.
Spain Server Workload Fit
Hardware selection should follow measured workload behavior.
For interactive APIs, compare per-core performance, concurrency, and p99 latency at peak load. For databases, prioritize active working-set memory and storage latency under representative read/write patterns.
The fio testing framework measures IOPS, throughput, and completion-latency percentiles. Reproduce production block sizes, queue depths, concurrency, and read/write ratios rather than relying on sequential throughput figures.
Caching workloads may primarily need RAM. Batch processing emphasizes completion time. Download origins need sustained storage throughput and network goodput. Consolidated services require tests that reproduce simultaneous peaks.
For an API expecting significant growth, a useful capacity test is to replay forecast peak traffic plus a defined burst margin while monitoring p99 latency, CPU utilization, memory pressure, and error rates. Select the margin from traffic variability, expected growth, and the service’s ability to absorb sudden demand.
Set Workload and Service Acceptance Thresholds Before Approving a Hosting Offer
Approve a dedicated server in Spain against documented production requirements, not specifications alone. Establish workload-specific latency, throughput, utilization, and recovery thresholds before testing. Record the evidence, responsible owner, and rejection condition for every gate. Production SLOs, measured baselines, and forecast demand should determine final approval.
Dedicated Server Acceptance Worksheet
Each owner should document test evidence and approve or reject the relevant gate. Establish thresholds from the production baseline and the application’s requirements.
| Decision Gate and Owner | Acceptance Criteria and Required Evidence | Reason to Reject |
|---|---|---|
| Physical location — Infrastructure lead | Madrid confirmed; order details, test endpoint, and provisioned server consistent with intended metro | Only country-level location disclosed or deployment differs |
| User-path network — Network engineer | Priority Spanish user cohorts meet the application’s p95 RTT budget and packet-loss tolerance. Evidence: timestamped measurements by ASN, compared with the incumbent | Material user cohorts exceed their latency budget or experience persistent application-impacting loss |
| Routing — Network engineer | IPv4/IPv6 paths remain within latency budgets across busy and quiet periods. Evidence: recurring traces and application timings | Recurring detours cause p95/p99 regressions |
| Port throughput — Network engineer | Controlled tests demonstrate sufficient sustained throughput for forecast peak egress and concurrent transfers. Evidence: iperf3 results, endpoint capacity, CPU utilization, and test parameters | Achievable throughput cannot support required traffic after endpoint limitations are excluded |
| Application CPU — Application owner | Forecast peak and required burst margin pass with p99 inside SLO and sufficient CPU headroom. Evidence: load-test traces | Latency target fails before required peak or CPU contention causes unacceptable queueing |
| Memory — Application owner | Peak working set, caches, and background processes fit within RAM without sustained swapping or latency-damaging reclaim. Evidence: memory telemetry | Memory pressure or swapping causes application latency or reliability failures |
| Storage — Database or storage owner | Representative fio workload meets application p99 latency, IOPS, and throughput requirements under expected concurrency | Storage latency deteriorates at expected concurrency |
| Operations — Infrastructure lead | Inventory, provisioning, support, deployment, restore, and recovery procedures verified. Evidence: order confirmation and recovery-test results | Required configuration or recovery procedure cannot be confirmed |
Network acceptance should reflect the locations and access networks serving actual users. Measurements from controlled mainland-Spain probes toward Madrid can establish a useful baseline, but they do not substitute for application measurements from the intended client population.
Similarly, ICMP packet loss requires corroboration through TCP retransmissions and application errors. High-speed throughput tests may require multiple concurrent flows.
Most importantly, retain the rejection column after shortlisting. An attractive price cannot compensate for a route that repeatedly misses the latency budget or hardware that saturates before forecast peak.
Matching Spain Servers to Workloads
Once route testing supports a Madrid deployment, use Melbicom’s Spain configuration catalog to shortlist servers by CPU, RAM, storage, bandwidth, data transfer, and price.
Memory illustrates why workload measurements matter. An application comfortably using 64 GB gains little from purchasing 256 GB without a corresponding requirement. A database with a 110 GB active working set, however, may find 128 GB insufficient for comfortable operating headroom, making a higher-memory configuration worth evaluating.
Network sizing follows the same logic. A service averaging 400 Mbps but bursting to 4 Gbps during releases requires a different configuration from one with steady traffic. Account for overlapping backups, replication, and application egress.
Our Madrid location supports per-server networking up to 40 Gbps. Match the port to your peak traffic, then choose traffic terms for the expected transfer volume.
For transfer-heavy workloads, our Spain unmetered dedicated-server options provide another configuration path to evaluate alongside expected traffic economics. Select the port speed and traffic terms appropriate to the workload.
The Final Buying Decision for Spain
A dedicated server in Spain is production-ready only when its physical location, routes to important user networks, hardware capacity, and operational requirements have passed explicit acceptance tests.
The essential buying rules are:
- Prioritize the cohorts that matter. Build network tests around actual Spanish user traffic and business-critical applications rather than national averages alone.
- Test simultaneous workload peaks. Validate application latency, database I/O, background jobs, and network egress together when they share hardware.
- Separate advertised capacity from measured delivery. Facility network capacity, port rates, and application throughput are different measurements.
- Make recovery part of procurement. Define backup ownership, restoration objectives, and operational responsibilities before scheduling migration.
- Preserve the right to reject. A configuration that misses a critical production threshold should not pass merely because its location, price, or specifications appear attractive.
The right configuration need not be the largest or fastest advertised. It must meet measurable requirements with enough headroom for changing demand.
Explore Dedicated Servers in Spain
Melbicom offers dedicated servers in Spain from Madrid, with ready-to-go configurations and metered or unmetered bandwidth options.
Get expert support with your services
Blog
10Gbps Dedicated Server Providers: Compare Ports, Terms and Network
A 10Gbps dedicated server can have a 10Gbps Ethernet interface without delivering 10Gbps of committed bandwidth. That distinction matters when streaming traffic, replication jobs, or bulk transfers depend on sustained throughput.
According to TeleGeography’s 2026 research, international internet bandwidth reached 2,259 Tbps, growing 23% year over year. Average and peak international traffic grew at approximately 24% annually between 2022 and 2026.
Selecting a 10Gbps unmetered dedicated server therefore requires examining six separate factors: port speed, committed capacity, transfer accounting, acceptable use, network routes, and operational terms.
Melbicom 10Gbps– 10Gbps unmetered transfer – 21 Tier III & IV DCs – 24/7 engineering support |
|
Which 10Gbps Providers Define Bandwidth and Transfer Terms?
10Gbps dedicated server providers should document the physical port rate, committed bandwidth, transfer accounting, acceptable-use restrictions, and contractual conditions. A 10Gbps interface alone does not establish guaranteed throughput. Buyers should require written confirmation of the committed rate, measurement conditions, and service boundary before treating advertised connectivity as production capacity.
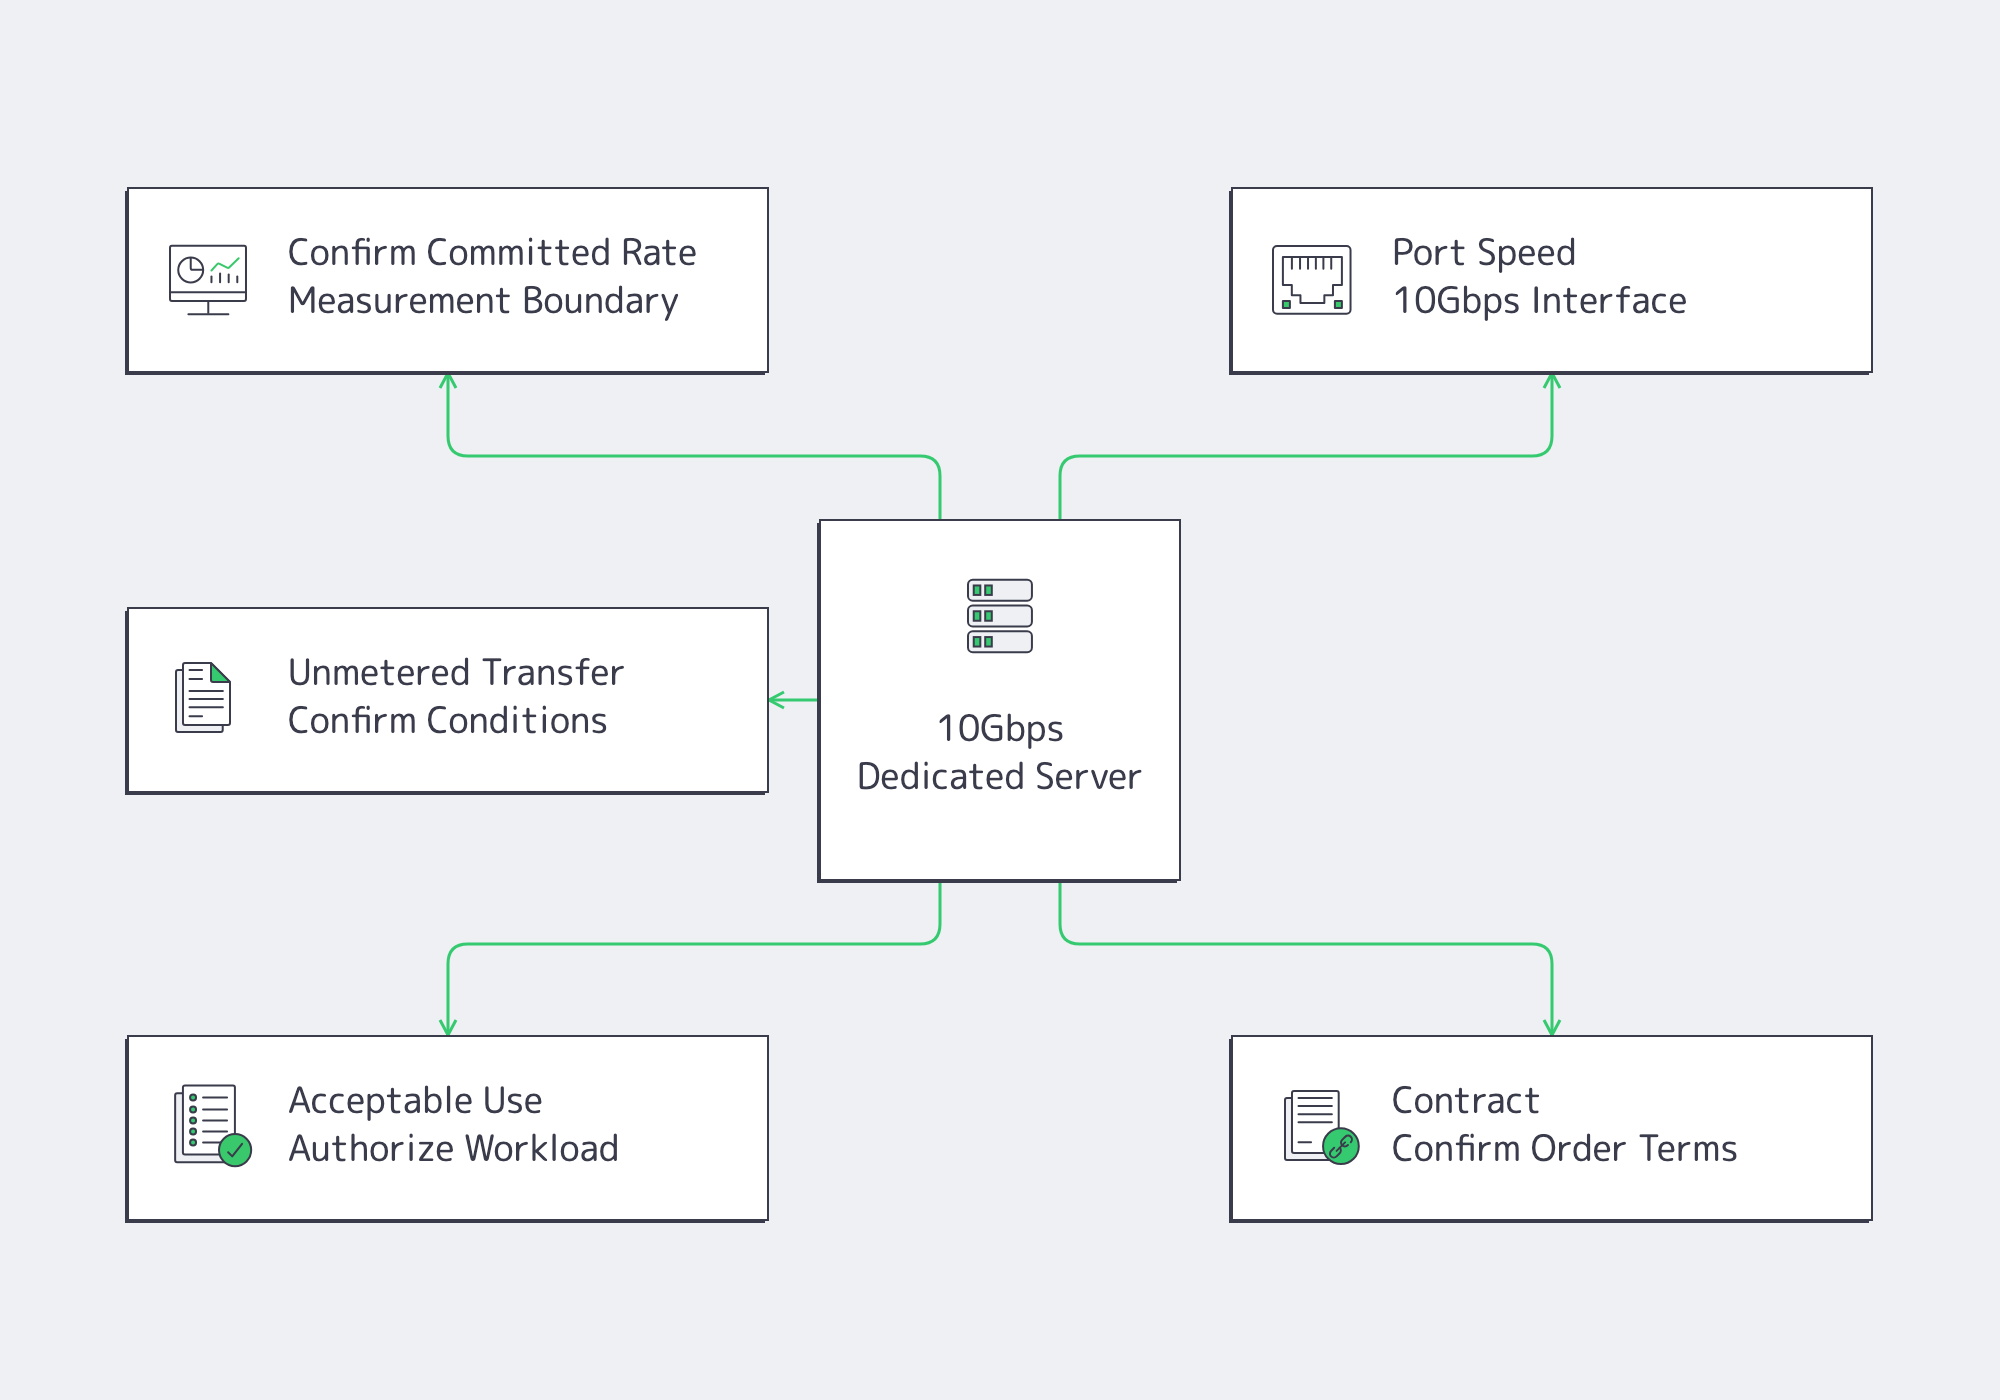
Melbicom’s 10Gbps unmetered offering combines a 10Gbps port with consistent and guaranteed bandwidth. We provide monthly billing, a one-month minimum payment period, and no required long-term commitment for dedicated servers.
Compare documented service characteristics with actual workload requirements—not marketing labels.
Port Speed Versus Committed Bandwidth
A 10Gbps port specifies interface capability, not necessarily available upstream capacity.
The IEEE 802.3 Ethernet standard defines link operation at specified speeds. Meanwhile, MEF’s bandwidth-profile framework, Section 15.1, defines CIR as the average rate of traffic treated as committed under its bandwidth-profile model.
MEF terminology provides a useful distinction between physical link capacity and a committed service rate.
For 10Gbps port guarantees, distinguish three quantities:
Port speed describes the server-facing interface. Committed bandwidth describes capacity promised at a defined service boundary. Application throughput reflects software transfers after protocol overhead, congestion control, CPU, storage, and remote-network conditions.
However, a server-side commitment cannot guarantee identical throughput to every internet destination. RFC 6349, an Informational RFC published in August 2011, provides a framework for evaluating sustained TCP throughput and identifying bottlenecks across managed IP networks.
For committed bandwidth hosting, ask where the commitment applies, whether ingress and egress receive equivalent treatment, what measurement interval is used, and how throughput can be validated.
Melbicom’s infrastructure supports up to 200 Gbps per server globally.
Metered Versus Unmetered Transfer Terms
Transfer accounting determines how traffic volume affects billing. Port capacity determines how quickly traffic can move.
Metered services associate consumption with an allowance or usage-based accounting. Unmetered services remove volume-based metering as the central billing constraint, but physical port limits and applicable use restrictions remain.
At continuous full line rate in one direction over 30 days, a 1Gbps port could theoretically transfer 324 TB, a 2Gbps port 648 TB, and a 10Gbps port 3,240 TB (3.24 PB). These decimal figures exclude protocol overhead and interruptions. They represent engineering ceilings, not guaranteed transfer volumes, customer allowances, or promised sustained throughput.
A hypothetical 100TB monthly allowance, by comparison, represents approximately 309Mbps averaged across 30 days.
Melbicom distinguishes bandwidth and data transfer in our dedicated-server configurations, while our 10Gbps product offers unmetered transfer.
For streaming distribution and high-volume data platforms, dedicated server transfer terms should establish whether sustained traffic creates additional charges, restrictions, shaping conditions, or approval requirements. These conditions matter independently of whether a service is described as unmetered.
Matching 1Gbps, 2Gbps, and 10Gbps Offers to Production Workload Profiles
Match 1Gbps, 2Gbps, and 10Gbps dedicated-server offers to measured p95 and peak demand, burst duration, transfer deadlines, and projected growth. As illustrative planning thresholds—not guaranteed performance—1Gbps suits p95 egress below roughly 600Mbps, 2Gbps suits approximately 600Mbps–1.3Gbps, and 10Gbps suits sustained multi-gigabit workloads or transfers requiring substantially shorter completion windows.
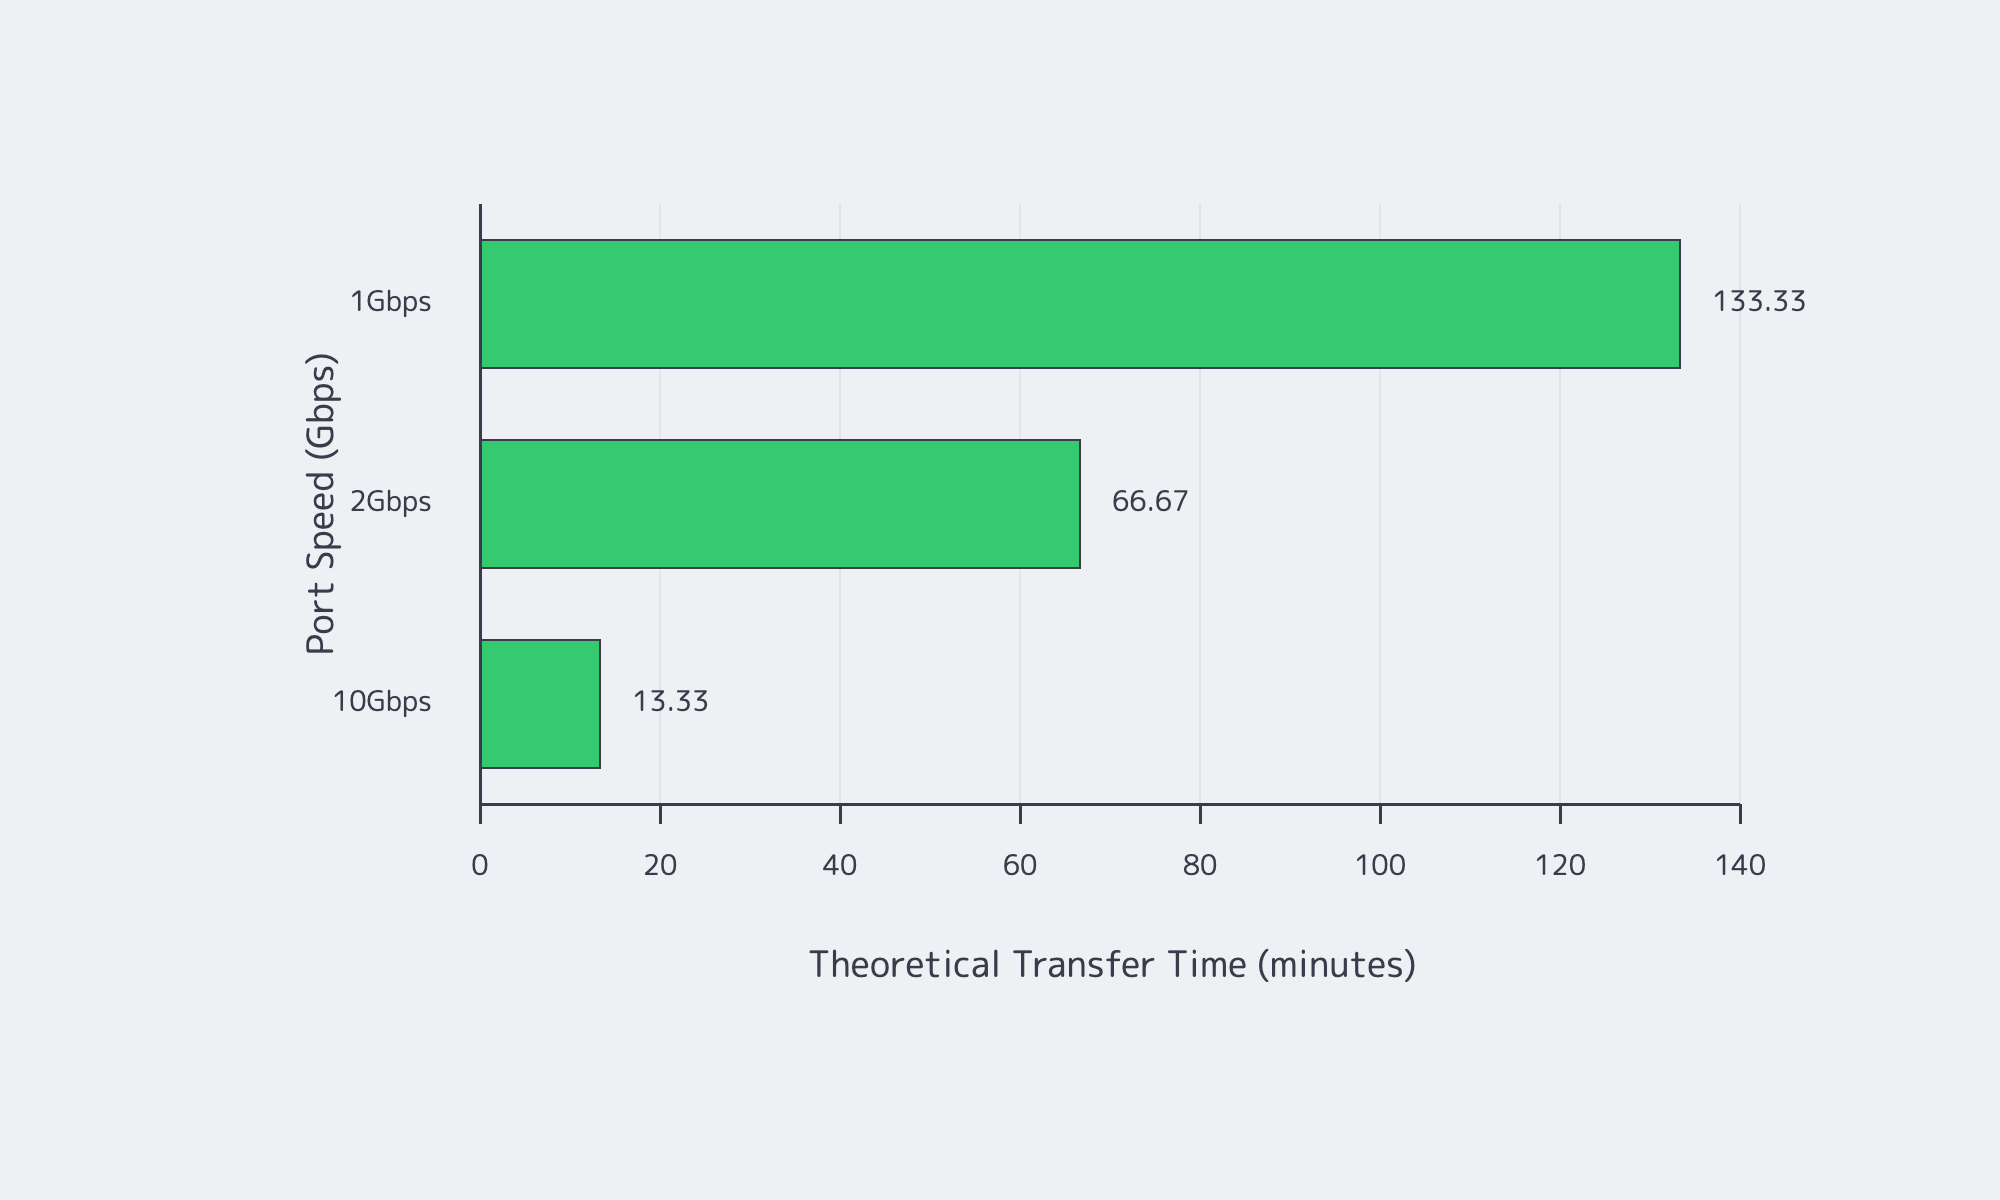
Melbicom offers 1Gbps, 2Gbps, and 10Gbps unmetered dedicated servers.
Ericsson’s Q2 2026 Mobility Report recorded more than 220 EB of monthly mobile-network traffic, including fixed wireless access, up 23% year over year. Video accounted for approximately three-quarters of mobile data traffic at the end of 2025.
These industry figures provide context, not a forecast for an individual deployment. Port selection must still follow measured workload demand.
Workload Worksheet: Choosing a Port
The following thresholds are illustrative planning guidelines. They assume the measurements represent actual server-interface traffic over relevant production periods.
| Observed Production Workload | Recommended Port | Upgrade Trigger |
|---|---|---|
| p95 egress ≤600Mbps; short peaks below 800Mbps; flexible transfer windows | 1Gbps | Sustained congestion, insufficient headroom, or missed transfer deadlines |
| p95 egress 600Mbps–1.3Gbps; peaks below approximately 1.6Gbps; regular replication | 2Gbps | Sustained traffic above 1.3–1.5Gbps or multi-gigabit transfer requirements |
| Sustained multi-gigabit egress; bursts exceeding 2Gbps; large distribution or replication jobs | 10Gbps | Validate storage, CPU, and remote-network throughput before deployment |
At theoretical line rate, transferring 1TB requires approximately 133 minutes at 1Gbps, 67 minutes at 2Gbps, or 13.3 minutes at 10Gbps. Actual transfers take longer because useful application throughput depends on protocol overhead, connection behavior, storage performance, and the available network path.
For data platforms, the decisive question is often the maximum acceptable replication, restore, or replay window.
For streaming, estimate outbound traffic using delivered bitrate multiplied by concurrent streams, then validate against measured interface utilization. A streaming origin may require substantially less bandwidth than a server distributing content directly to viewers.
Burst duration also matters: five seconds at 1.8Gbps differs operationally from 45 minutes at the same rate.
Growth must be modeled explicitly. A workload with 1.2Gbps p95 egress growing 10% quarterly may exhaust comfortable 2Gbps headroom over the deployment period.
Melbicom operates infrastructure across 21 data centers in 19 server cities and 17 countries. Our data-center directory provides location-specific network capabilities.
For example, our infrastructure in Amsterdam, Frankfurt, Paris, Singapore, and Warsaw supports server networking up to 200 Gbps, while Madrid and Mumbai have network ceilings of 40 Gbps per server. These are location-level capabilities, distinct from the bandwidth assigned to an individual ready-to-go configuration.
Verify Route Evidence, Support Obligations, and Acceptable Use Before Ordering
A bandwidth commitment establishes capacity at a defined network boundary, not performance across every internet route. Before ordering, verify paths from representative destination networks, confirm the support team’s responsibilities, and obtain written approval for high-load workloads where required. These checks reduce uncertainty that port specifications alone cannot resolve.
Network Evidence Must Match Destination Traffic
Melbicom’s network architecture includes a 14+ Tbps aggregate network, 23 transit providers, and 29 Internet Exchange Points.
Our data-center directory provides test IPs and downloadable objects for locations including Amsterdam, Frankfurt, Los Angeles, Madrid, Mumbai, Paris, Singapore, and Tokyo.
Route measurements provide the additional information needed to evaluate connectivity to a particular destination network.
RIPE Atlas enables distributed ping and traceroute measurements. Its Path Analysis tool supports comparisons of traceroutes over time, helping identify routing changes, ASN/IXP transitions, and latency shifts.
PeeringDB provides complementary interconnection information, although its user-maintained records should not substitute for measurements.
A useful acceptance test captures latency distributions, packet loss, route stability, and sustained TCP throughput from representative networks during relevant traffic periods.
For throughput testing, RFC 6349 provides a framework for examining TCP behavior, including round-trip time, bandwidth-delay product, and single versus multiple connections. Measurements should distinguish application goodput from link capacity and avoid treating results from one destination as universally representative.
Support Scope and Acceptable Use
Melbicom provides 24/7 engineering support. Our services agreement defines the included dedicated-server technical support scope as server hardware and network connectivity within the data center. Customer software configuration and operation remain outside that scope unless expressly agreed.
Acceptable use requires particular attention for streaming and data-distribution workloads.
Melbicom’s acceptable-use provisions require prior consent or authorization for certain high-load activities, including streaming, file-sharing, storage distribution, or P2P services where applicable. Provide expected ingress, egress, traffic volume, and application characteristics before purchasing so our team can confirm any required approval.
A Decision Framework for Selecting 10Gbps Dedicated Server Providers
A practical selection process starts with workload evidence and ends with documented acceptance criteria.
First, establish p50, p95, and peak utilization, distinguishing inbound and outbound traffic. Record burst duration, transfer deadlines, destination networks, and projected growth.
Next, verify the port commitment, transfer model, route evidence, acceptable-use conditions, and support boundaries against those requirements.
Questions to Resolve Before Purchasing
- Port guarantees: Does 10Gbps describe the interface, configured limit, and committed capacity? Where is the commitment measured, over what interval, and does it cover both directions?
- Transfer terms: Does unmetered traffic cover ingress and egress? Are there overages, sustained-use restrictions, percentile billing, or shaping conditions?
- Acceptable use: Does the intended streaming, replication, or distribution workload require prior written consent under the applicable agreement provisions?
- Network routes: Which test endpoints represent the selected location? What do repeated latency, loss, traceroute, and throughput measurements show?
- Support: Who owns hardware and network incidents versus OS, TCP, storage, and application tuning?
- Contract: When does billing begin? What are the minimum payment period, cancellation conditions, and applicable order terms?
- Acceptance: Which measurable throughput and route results must be achieved before production deployment, and which measurement methods will be used?
Melbicom’s 10Gbps offer, network documentation, and location-specific test endpoints help evaluate bandwidth, interconnection, and deployment location. Our team can help align a configuration with the workload profile and target networks.
The critical distinction remains: network scale demonstrates infrastructure capability, while server-specific commitments and route measurements establish whether a particular deployment meets its requirements.
Choose Bandwidth for Your Workload
The right dedicated-server port is the smallest capacity tier that reliably accommodates measured production traffic, transfer deadlines, and planned growth.
A 1Gbps service may comfortably support moderate egress. A 2Gbps service provides additional room for sustained traffic and replication. A 10Gbps service becomes compelling when multi-gigabit throughput or demanding transfer windows justify it.
But port speed alone is insufficient. Committed capacity, unmetered transfer conditions, acceptable-use authorization, route measurements, and operational responsibilities must align before deployment.
The purchasing decision should produce a documented workload profile, a confirmed service specification, and measurable acceptance criteria—not simply an order for the fastest available port.
Explore Melbicom’s 10Gbps Dedicated Servers
Melbicom offers 10Gbps unmetered dedicated servers backed by a 14+ Tbps network and 24/7 engineering support. Our team can help select a configuration for your workload.