
Blog

How to Calculate Video Streaming Bandwidth and Delivery Costs
Video streaming creates two infrastructure demands that are easy to confuse: monthly delivery volume, which determines how much data a CDN transfers, and peak capacity, which determines how much throughput the delivery network must sustain when viewers arrive simultaneously.
These two measurements require different inputs. Monthly volume depends on bitrate, viewing duration, and audience size. Peak capacity depends on how many viewers watch simultaneously and the bitrate they receive.
Here’s how to calculate those requirements for an on-demand library, recurring live programming, and a major live event.
Video Delivery– HLS and DASH delivery – Premium and Volume plans – Traffic-based plan selection |
 |
What Inputs Does a Video Streaming Bandwidth Calculator Need?
A realistic video streaming bandwidth calculator needs average delivered bitrate, actual viewing duration, audience or session count, peak concurrent viewers, and explicit overhead assumptions. Monthly transfer estimates should use average delivered bitrate and viewer-hours. Peak capacity estimates require simultaneous audience size and a peak planning bitrate, with additional headroom for traffic variation.
Use Weighted Bitrate
Adaptive-bitrate (ABR) streaming changes video quality as network conditions fluctuate. Using the highest available rendition for every session can substantially overestimate delivery volume.
IETF RFC 8216 distinguishes AVERAGE-BANDWIDTH, the average segment bitrate, from BANDWIDTH, the peak segment bitrate.
A streaming bandwidth calculator should weight bitrate by actual viewing time:
Weighted bitrate = Σ (rendition viewing share × average bitrate)
Assume 55% of viewing time at 5 Mbps, 30% at 3 Mbps, and 15% at 1.5 Mbps.
(0.55 × 5) + (0.30 × 3) + (0.15 × 1.5) = 3.875 Mbps
Include audio and container data in the aggregate delivered rate, but do not add them again if the measured bitrate already includes them.
Codec efficiency also matters because different encoding configurations can produce different bitrates at comparable visual quality. Apple’s HLS authoring guidance explains that bitrate depends on codec, encoder, frame rate, resolution, content complexity, and target quality. Use the measured bitrate of the encoding ladder intended for delivery rather than assuming a fixed saving from a codec change.
Calculate Actual Viewer-Hours
Catalog duration is not viewing duration.
Use actual watch time:
VOD viewer-hours = monthly viewers × sessions/viewer × hours/session
Live viewer-hours = events/month × unique viewers/event × hours watched
Track unique, average concurrent, and peak concurrent viewers separately. A large monthly audience does not imply many simultaneous viewers.
For the worked examples, assume a 3% monthly delivery allowance (O = 1.03) for additional transferred bytes beyond the modeled media payload, and 25% peak capacity headroom (H = 1.25) for throughput planning. The examples’ aggregate delivered bitrates already include audio and container data. The factors apply separately to monthly volume and peak capacity.
How Should Monthly Streaming Volume and Peak Capacity Be Calculated Separately?
Monthly streaming volume equals viewer-hours multiplied by average delivered bitrate and a byte-conversion factor. Peak capacity equals peak concurrent viewers multiplied by peak planning bitrate and engineering headroom. At 1 Mbps, one viewer-hour transfers 0.45 GB. Monthly terabytes determine transfer-cost exposure, while peak gigabits per second determine simultaneous delivery requirements.
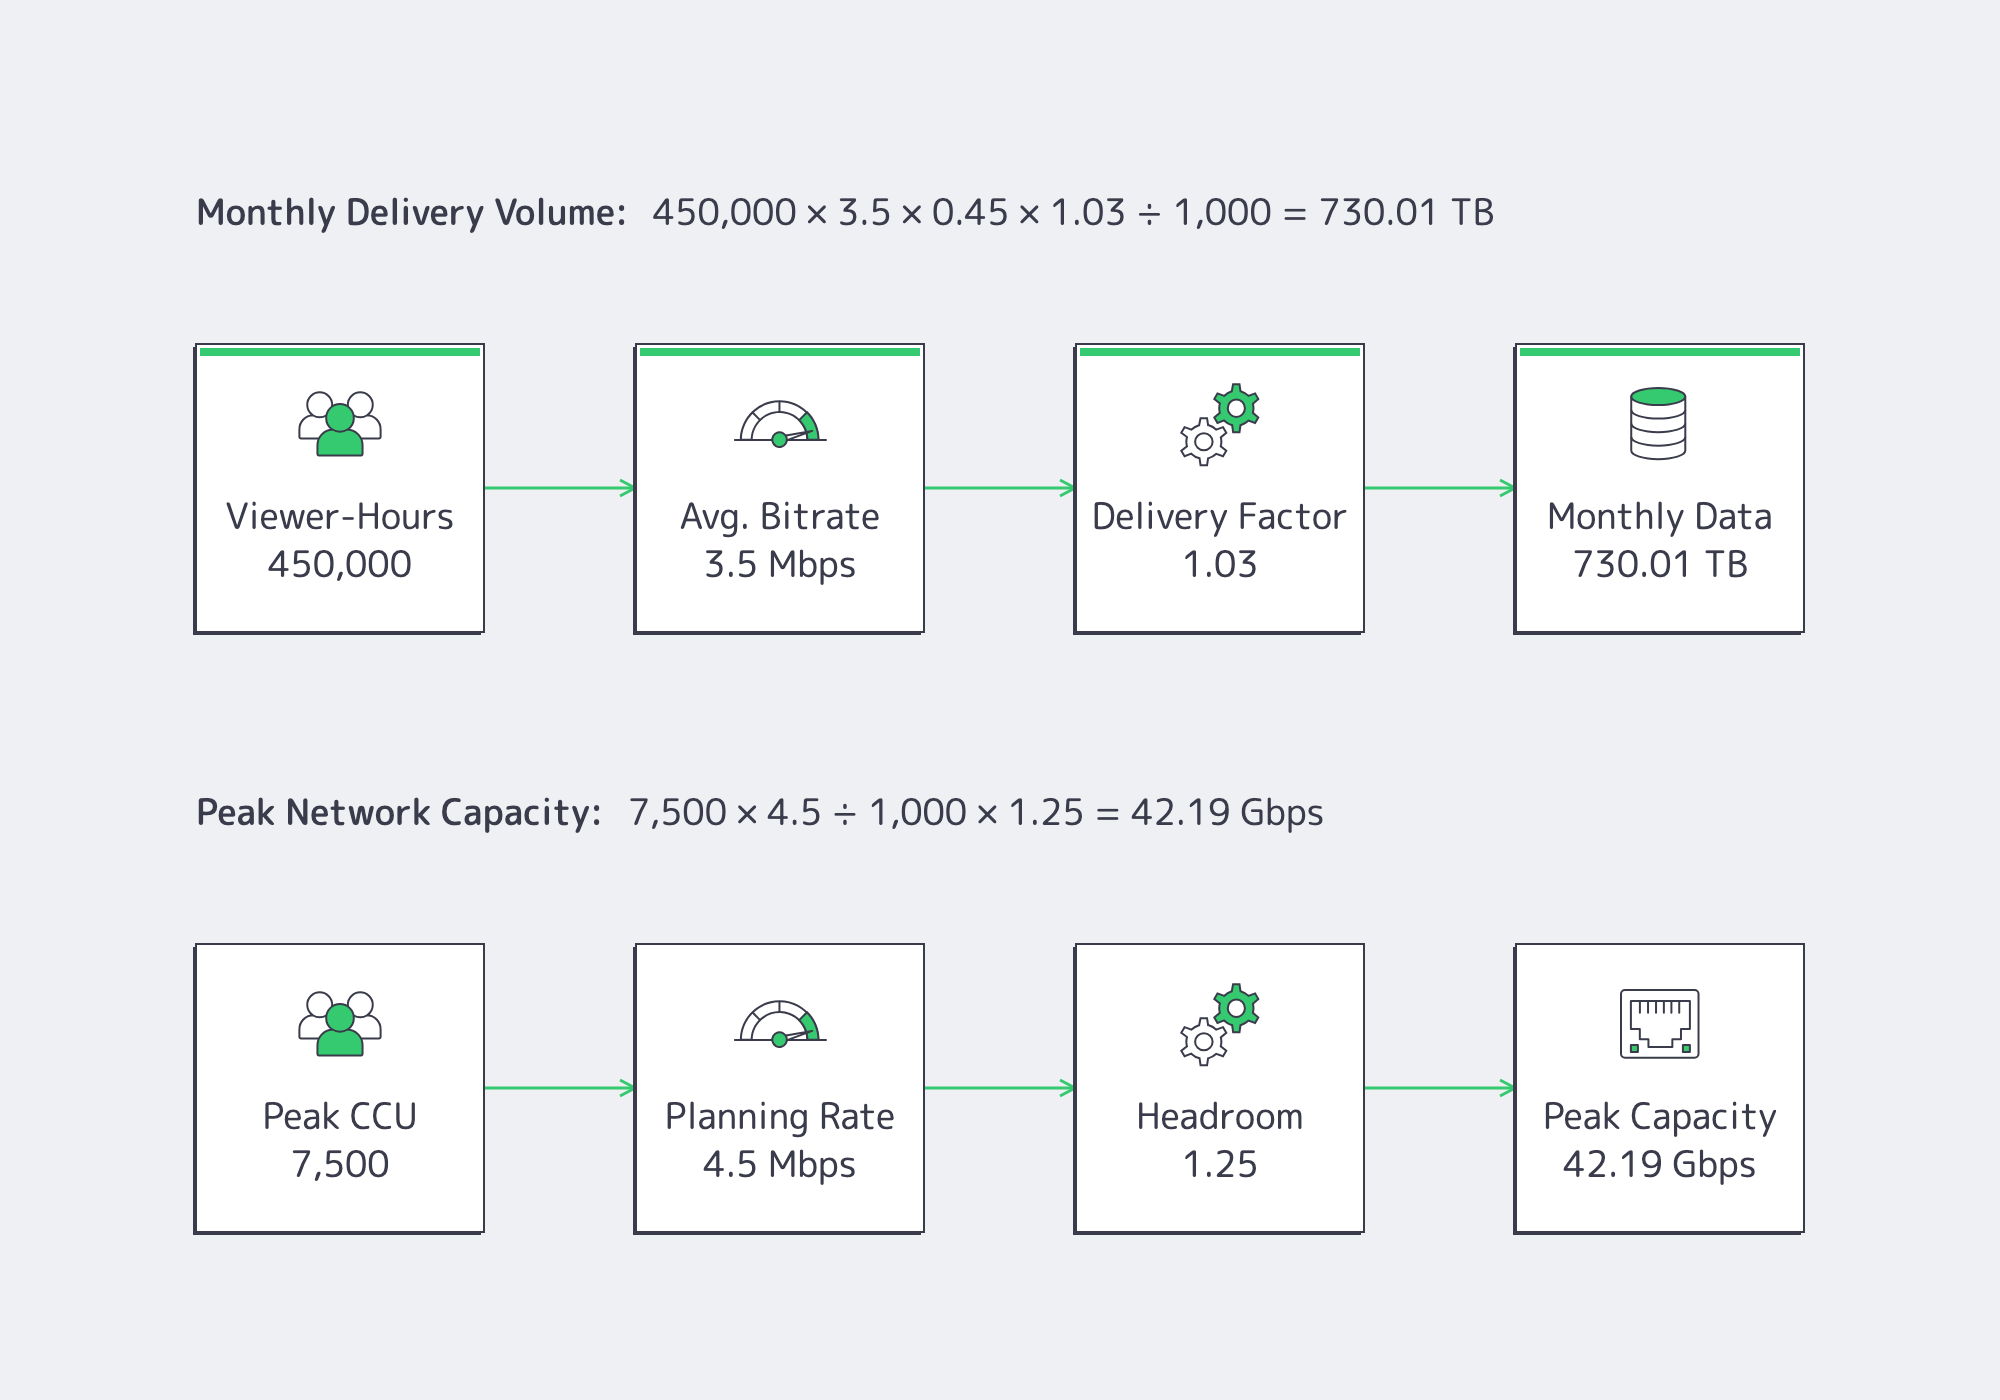
Monthly Delivery Volume
Using decimal units:
1 Mbps × 3,600 seconds ÷ 8 = 0.45 GB
GB/month = viewer-hours × average Mbps × 0.45 × O
Assume 1 TB = 1,000 GB and 1 PB = 1,000 TB. Check the billing units.
Peak Concurrent Capacity
The peak planning bitrate should reflect segment behavior and the expected rendition mix during peak demand, not simply the monthly average.
Peak Gbps = peak CCU × peak planning Mbps ÷ 1,000 × H
Apple’s HLS guidance distinguishes average and peak segment rates, with different measurement expectations for VOD and live streams. That makes measured manifests and playback telemetry more useful than a fixed multiplier applied indiscriminately.
Monthly Volume and Peak Capacity
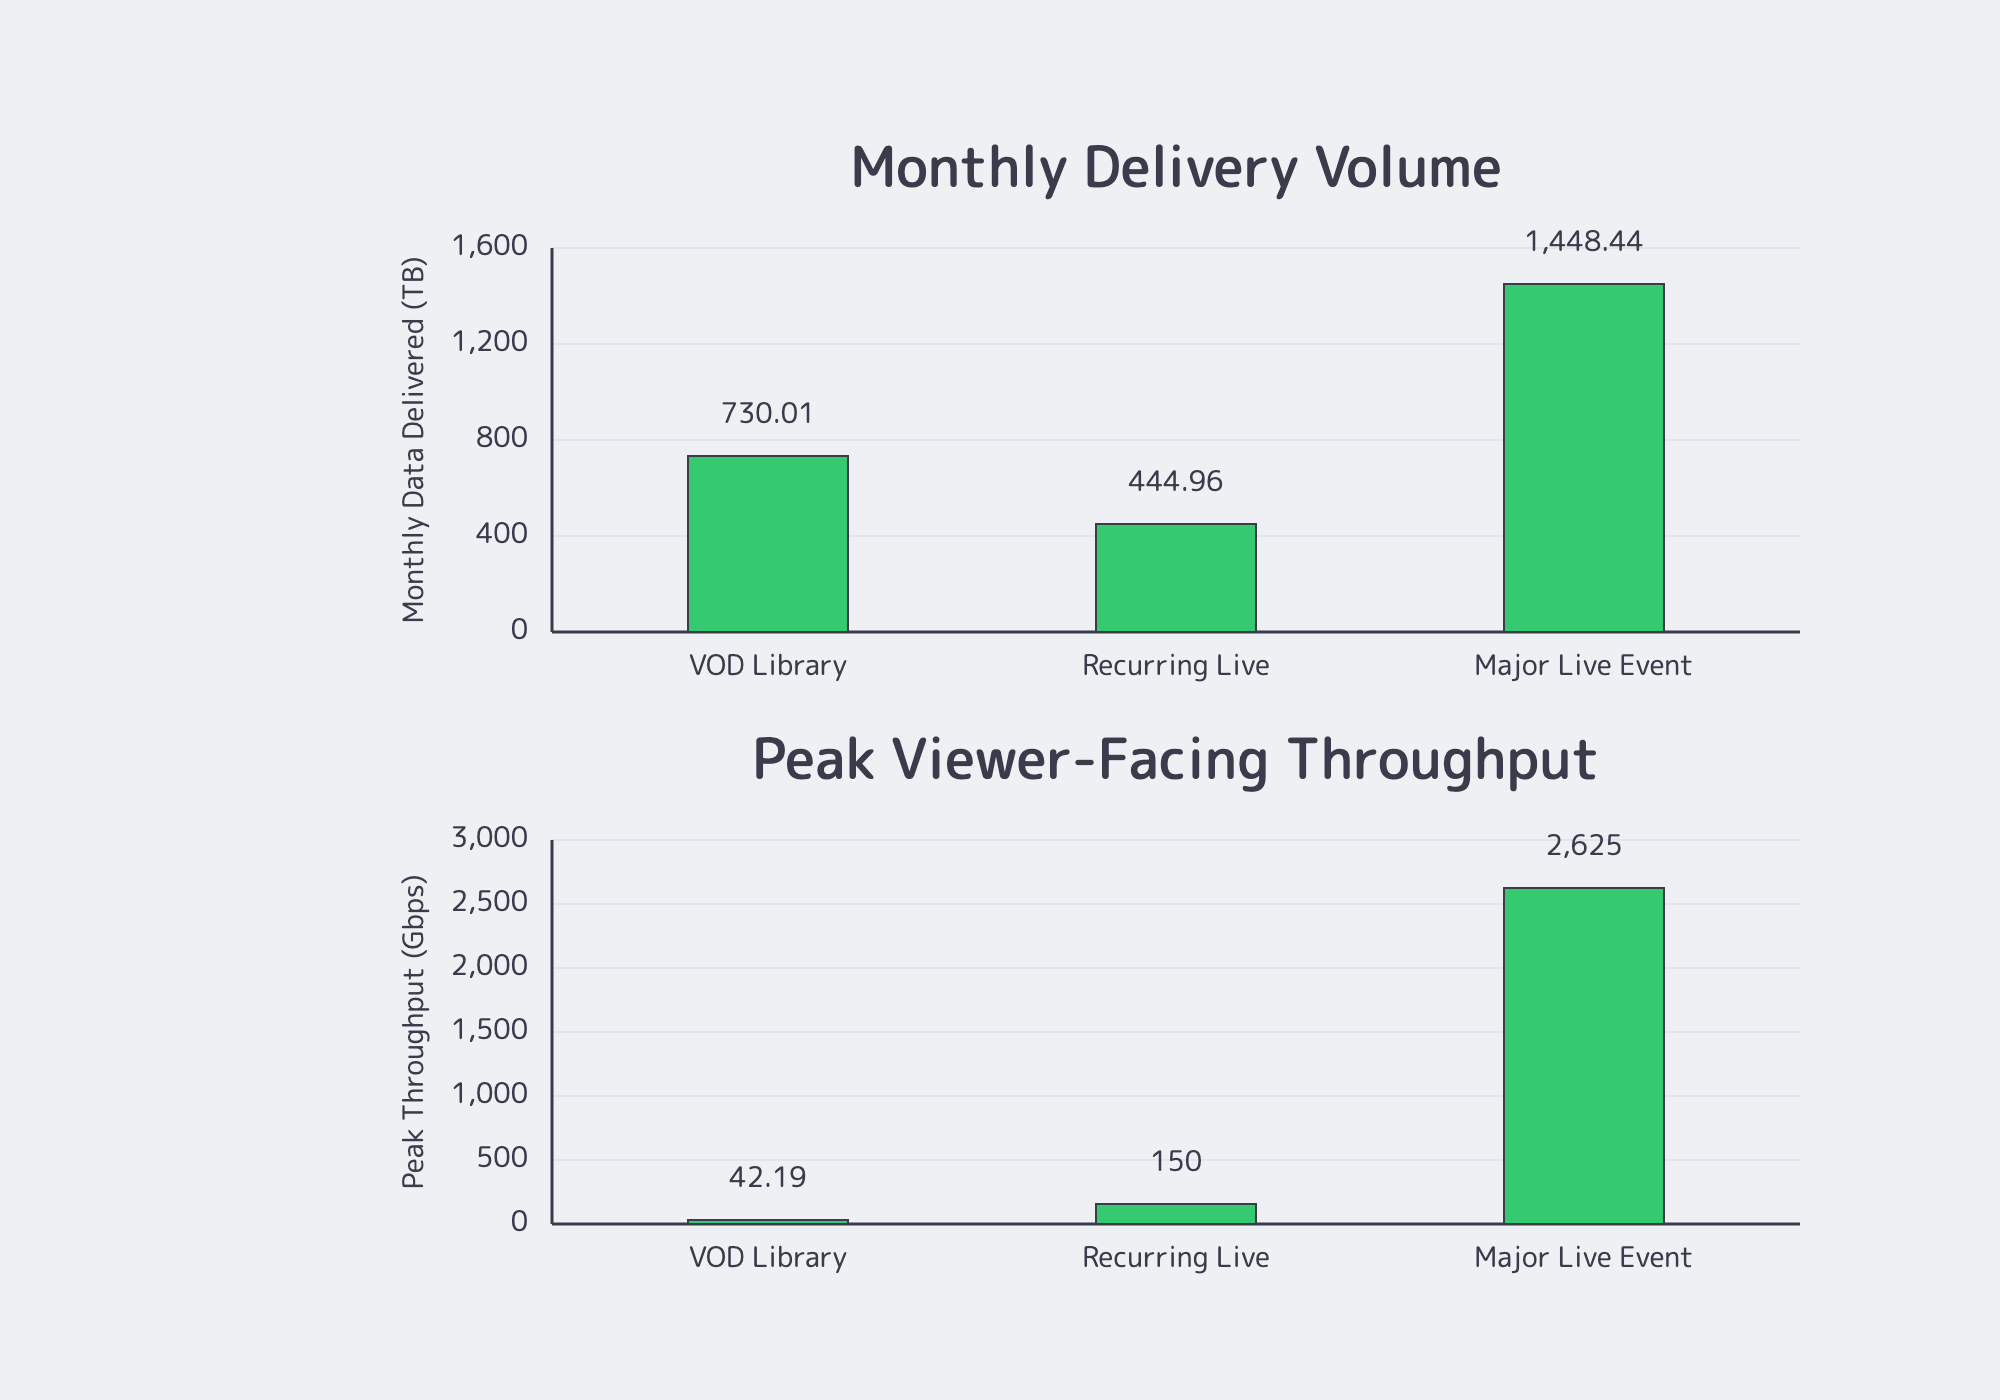
| Workload | Viewer-hours/month | Delivery volume | Peak CCU | Planned peak egress |
|---|---|---|---|---|
| VOD library | 450,000 | 730.01 TB | 7,500 | 42.2 Gbps |
| Recurring live | 192,000 | 444.96 TB | 20,000 | 150 Gbps |
| Major live event | 625,000 | 1,448.44 TB | 300,000 | 2,625 Gbps |
The VOD library transfers approximately 64% more monthly data than recurring live programming, yet recurring live requires approximately 3.6 times the peak throughput.
That difference is why converting monthly terabytes into average Gbps cannot establish sufficient live-streaming capacity.
VOD and Live Delivery Costs
Delivery costs depend on total viewer-hours, delivered bitrate, and applicable CDN pricing, but capacity requirements change dramatically with concurrency. VOD spreads consumption across many sessions, recurring broadcasts concentrate demand into scheduled windows, and major events produce extreme simultaneous loads. Each workload needs separate monthly-volume and peak-throughput calculations using explicit audience assumptions.
VOD Library: Bandwidth Requirements
Assume 50,000 monthly viewers, 12 sessions per viewer, 45 minutes watched per session, 3.5 Mbps average delivered bitrate, 7,500 peak concurrent viewers, and 4.5 Mbps peak planning bitrate.
Viewer-hours: 50,000 × 12 × 45/60 = 450,000
Monthly volume: 450,000 × 3.5 × 0.45 × 1.03 = 730,012.5 GB = 730.01 TB
Peak capacity: 7,500 × 4.5 ÷ 1,000 × 1.25 = 42.19 Gbps
Melbicom’s Volume Plus 500 CDN plan includes 500 TB for €1,500 monthly, with additional traffic at €0.003/GB.
€1,500 + (730,012.5 − 500,000) × €0.003 = €2,190.04/month
This CDN transfer calculation assumes all modeled traffic is eligible for the plan and excludes encoding, storage, origin infrastructure, taxes, and other charges.
Recurring Live: Scheduled Concurrency
Assume 12 broadcasts monthly, each lasting two hours, with 30,000 unique viewers per event, 32 minutes of average viewing, 5 Mbps average bitrate, 20,000 peak concurrent viewers, and 6 Mbps peak planning bitrate.
Viewer-hours: 12 × 30,000 × 32/60 = 192,000
Monthly volume: 192,000 × 5 × 0.45 × 1.03 = 444,960 GB = 444.96 TB
Peak capacity: 20,000 × 6 ÷ 1,000 × 1.25 = 150 Gbps
Under Melbicom’s same Volume Plus 500 plan, monthly transfer fits within the 500 TB allowance, producing a €1,500 monthly CDN charge for the modeled workload.
Yet the required peak capacity is more than three times the VOD example. Scheduled viewing concentration, not monthly volume, drives that difference.
Major Live Event: Plan for Terabit-Scale Peaks
Assume one four-hour event with 500,000 unique viewers, 75 minutes of average viewing, 5 Mbps average bitrate, 300,000 peak concurrent viewers, and 7 Mbps peak planning bitrate.
Viewer-hours: 500,000 × 75/60 = 625,000
Monthly volume: 625,000 × 5 × 0.45 × 1.03 = 1,448,437.5 GB = 1.448 PB
Peak capacity: 300,000 × 7 ÷ 1,000 × 1.25 = 2,625 Gbps = 2.625 Tbps
At this scale, the appropriate Melbicom CDN cost output is Enterprise quote required, rather than extrapolating a lower-volume package.
A multi-terabit event needs regional capacity planning: aggregate network throughput differs from the capacity available for a particular audience distribution.
For a major event, our team can work with the expected traffic volume, geographic distribution, and peak throughput requirements to plan the delivery configuration.
Origin and Viewer-Facing Bandwidth
A 2.625 Tbps CDN delivery requirement does not imply 2.625 Tbps of origin egress.
In Melbicom’s live-sports streaming architecture, cacheable segments pass from packaging and origin infrastructure into CDN delivery.
A first-order estimate is:
Origin bytes ≈ CDN-delivered bytes × cache-miss ratio
This approximation assumes the cache-miss ratio represents origin-fetched bytes relative to edge-delivered bytes, not simply the percentage of requests that miss.
Actual origin requirements depend on cache-fill patterns, geographic distribution, cache keys, shielding, and failover. Use measured origin-fetch telemetry rather than estimating origin throughput directly from peak CCU.
From Calculations to Capacity
A useful video streaming bandwidth calculator produces three outputs: monthly delivered TB, peak viewer-facing Gbps, and origin-fetch requirements.
Each answers a different engineering question. Monthly transfer determines delivery-cost exposure. Peak throughput establishes simultaneous capacity needs. Origin-fetch traffic informs upstream infrastructure sizing.
For implementation, use the following checks:
- Measure actual watch duration and rendition-level viewing time rather than assuming complete playback.
- Calculate monthly bytes from viewer-hours and weighted average bitrate, ensuring audio and overhead are counted only once.
- Calculate peak Gbps independently from peak CCU and planning bitrate, using peak-time rendition data where available.
- Validate overhead, headroom, and cache-miss assumptions against telemetry.
- Check regional audience concentration and available delivery capacity before major events, rather than relying on aggregate network figures.
Melbicom’s CDN offers Premium destination-zone pricing and Volume traffic-oriented plans. The right selection depends on where viewers are located, how much data they consume, and whether the delivery footprint matches their distribution.
A useful optimization test is:
New monthly volume ≈ old volume × new average bitrate / old average bitrate
Reducing the VOD example’s weighted bitrate from 3.5 to 3.15 Mbps cuts modeled monthly delivery by approximately 73 TB, with viewer-hours and overhead unchanged. Test whether the encoding change preserves acceptable quality.
Choose Capacity from Bytes and Peaks

Monthly consumption and instantaneous demand require separate capacity calculations. Under the stated assumptions, 730 TB of VOD needs roughly 42 Gbps at peak, while the 1.448 PB major event needs 2.625 Tbps.
The strongest forecasts combine playback analytics, measured bitrates, concurrency profiles, and CDN telemetry. They turn an estimated transfer bill into an actionable capacity plan.
Match CDN Capacity to Your Workload
Deliver pre-transcoded HLS and DASH with Melbicom CDN. Compare Premium and Volume plans using your audience geography, monthly transfer, and peak delivery needs.