
Blog

CDN PoPs Explained: Do More Locations Always Mean Better Performance?
A CDN map makes comparison look simple: count the locations, compare the countries, and choose the largest footprint.
That approach can produce the wrong infrastructure decision.
A content delivery network point of presence only creates value when it improves delivery to actual users. Geographic proximity does not guarantee efficient routing, sufficient capacity, or fast content delivery. The IETF’s RFC 4786 explains that topological proximity does not necessarily translate into lower latency.
The buying question isn’t simply how many CDN locations exist. It’s how much of your actual audience can those locations serve within your performance targets?
CDN Coverage– Premium and Volume plans – Real-time traffic analytics – Raw delivery logs |
 |
Why Is CDN PoP Count Insufficient for Predicting Real User Performance?
CDN PoP count cannot reliably predict performance because routing policies, interconnection, and available capacity determine how users reach edge infrastructure. A nearby PoP may deliver worse latency than a distant, better-connected location. Buyers should compare the share of actual audience demand meeting application performance targets, rather than treating geographic coverage as proof of delivery quality.
A CDN PoP Is a Network Path
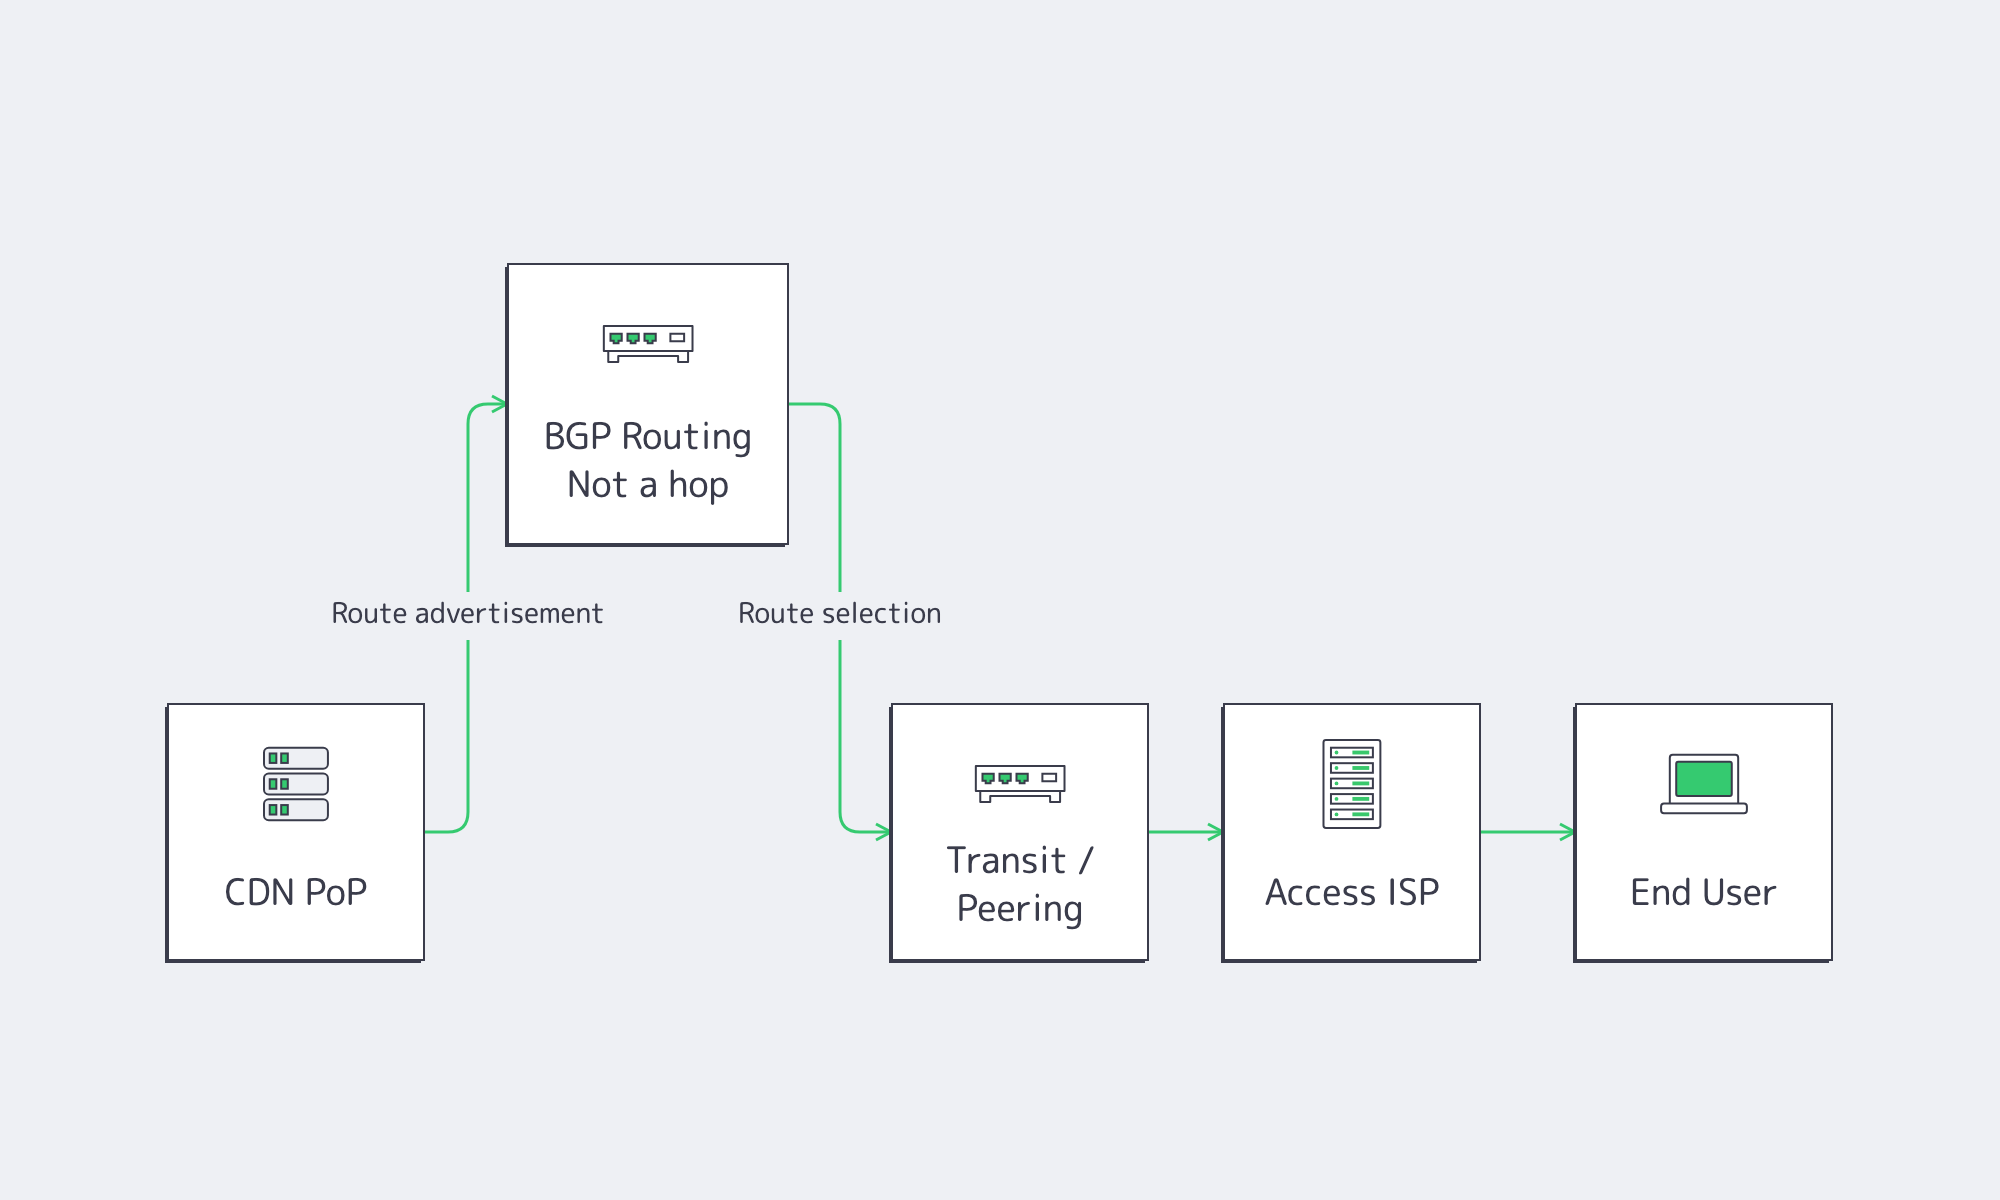
With IP anycast, multiple locations advertise the same service address. Border Gateway Protocol (BGP) determines which route traffic follows based on network topology and routing policies.
The resulting user population assigned to a PoP is called its catchment. As RFC 4786 describes, catchments are neither static nor reliably deterministic.
Consider a digital service concentrated in North America, Western Europe, India, and Brazil. Additional PoPs in markets generating little traffic may contribute less to overall performance than one better-connected PoP serving a major customer network.
The relevant delivery path is:
CDN location → routing advertisement → transit/peering path → access network → user
Not simply:
CDN location → user
Country-level coverage cannot capture the complexity of these connections. A CDN PoP’s physical location matters, but so do the networks exchanging traffic with it and the routing decisions determining which users reach it.
Which Audience Locations and Networks Matter for CDN Coverage?
The most valuable CDN locations serve countries, metropolitan areas, and autonomous systems responsible for meaningful application demand. Begin with the networks carrying the largest shares of traffic, then include smaller segments supporting important customers or latency-sensitive transactions. Evaluate actual serving PoPs and network paths rather than assuming that a location in the same country provides effective coverage.
Match CDN Locations to Audience Demand
Start with production traffic rather than the provider’s coverage map.
Choose a historical traffic window that captures normal operating patterns, local peak periods, and relevant events such as product launches or promotions. Segment demand by country, metro where available, autonomous system number (ASN), requests, transferred bytes, peak bandwidth, and workload.
ASN-level analysis matters because users in the same city can experience different routes through separate broadband or mobile networks.
RIPE Atlas supports measurements selected by country, IP prefix, and ASN. This makes it useful for testing representative access networks instead of relying exclusively on geographically distributed probes.
Build a demand model using:
Segment weight = segment demand / total demand
Choose bytes for bandwidth-intensive applications, requests for APIs, or sessions and transactions where those better represent business impact.
Rank segments by their contribution to demand. Prioritize the largest contributors, then include smaller networks where poor performance would materially affect customers or critical transactions.
Next, map each segment to the PoP actually serving it.
Nominal coverage means a CDN operates in a market. Effective coverage means representative users reach a location that meets application performance targets.
Interconnection Shapes CDN Coverage
Internet exchange points (IXPs) enable networks to exchange traffic, potentially avoiding inefficient transit paths. But IXP participation does not guarantee optimal routing.
A 2020 CDN routing study demonstrated the practical impact of routing policy: after a peering-policy change, median latency in affected regions fell from 40 ms to 16 ms.
These findings make provider-level evidence essential.
| Ask the CDN Provider | Evidence Worth Requesting | What It Establishes |
|---|---|---|
| Which PoPs serve our largest ASNs? | Catchment data, traceroutes | Effective audience coverage |
| How do PoPs reach our access networks? | Peering, IXP, transit information | Path efficiency |
| Is interconnection local or remote? | Routing details | Hidden transport distance |
| Can individual PoPs be tested? | Test IPs, headers, logs | Independent verification |
| What happens during route withdrawal? | Failover tests | Backup-path performance |
| What regional capacity is available? | PoP capacity, peak tests | Sustained delivery capability |
| Is delivery telemetry accessible? | Logs, cache status, analytics | Production visibility |
| How is regional traffic priced? | Zone and volume pricing | Coverage economics |
How Should CDN Capacity Be Validated Against Audience Demand?
CDN capacity validation requires representative traffic during the periods when the application experiences its greatest demand. Test important audience networks for latency distributions, time to first byte, packet loss, cache behavior, and sustained throughput. Define workload-specific performance targets, then calculate the share of demand meeting those targets while verifying sufficient capacity for expected peaks.
CDN PoP Testing Should Measure Tail Latency, Cache Behavior, and Throughput
Low ping alone does not establish that a PoP can sustain peak-demand throughput.
Separate testing into four layers:
Network reachability: Measure RTT, packet loss, and traceroute from representative networks using tools such as RIPE Atlas.
Connection establishment: Measure DNS, TCP or QUIC, and TLS timings, distinguishing cold connections from reused connections.
Response latency: Use the W3C’s Navigation Timing metrics to examine request initiation, first-byte response, and transfer completion.
Delivery throughput: Test realistic object sizes, concurrency, and sustained transfer rates. RFC 9097 defines controlled methods for measuring one-way IP capacity; RFC 9946 adds a standardized UDP capacity-testing protocol.
For meaningful comparisons, hold workload, object size, protocol, connection state, cache status, access network, and measurement window consistent.
Measure p50, p95, and p99 results separately. Median performance describes typical delivery, while higher percentiles reveal slower experiences that averages can conceal.
Validate Capacity Against Peak Demand
Global backbone capacity is not equivalent to available capacity at an individual PoP.
Evaluate regional egress, access-network interconnection, CDN-specific resources, and traffic concentration.
A publisher transferring 600 TB monthly may need modest average bandwidth but far more throughput during a six-hour software release.
Estimate:
Required regional capacity = forecast peak Gbps × safety factor
The safety factor should account for observed peak variability, expected traffic growth, simultaneous events, and the additional load remaining locations may need to absorb during a failure.
Select the factor by modeling these conditions against the forecast peak. Required regional capacity is the resulting total; headroom is the difference between that capacity and the forecast peak.
Cache performance also changes the equation. Warm cache hits avoid origin round trips; misses introduce edge-to-origin latency and additional transfer requirements.
Test both cache states, especially when applications mix static content with dynamic APIs. Distinguish CDN delivery performance from origin processing time.
For each important audience segment, record the serving PoP, RTT, loss, cold and warm connection times, cache-hit and cache-miss TTFB, throughput, errors, and percentiles.
Calculate Demand-Weighted SLO Coverage
Turn measurement results into a comparison metric:
weightᵢ = segment demand / total demand
passᵢ = 1 if the segment meets its SLO;
otherwise 0
Demand-weighted coverage = Σ(weightᵢ × passᵢ)
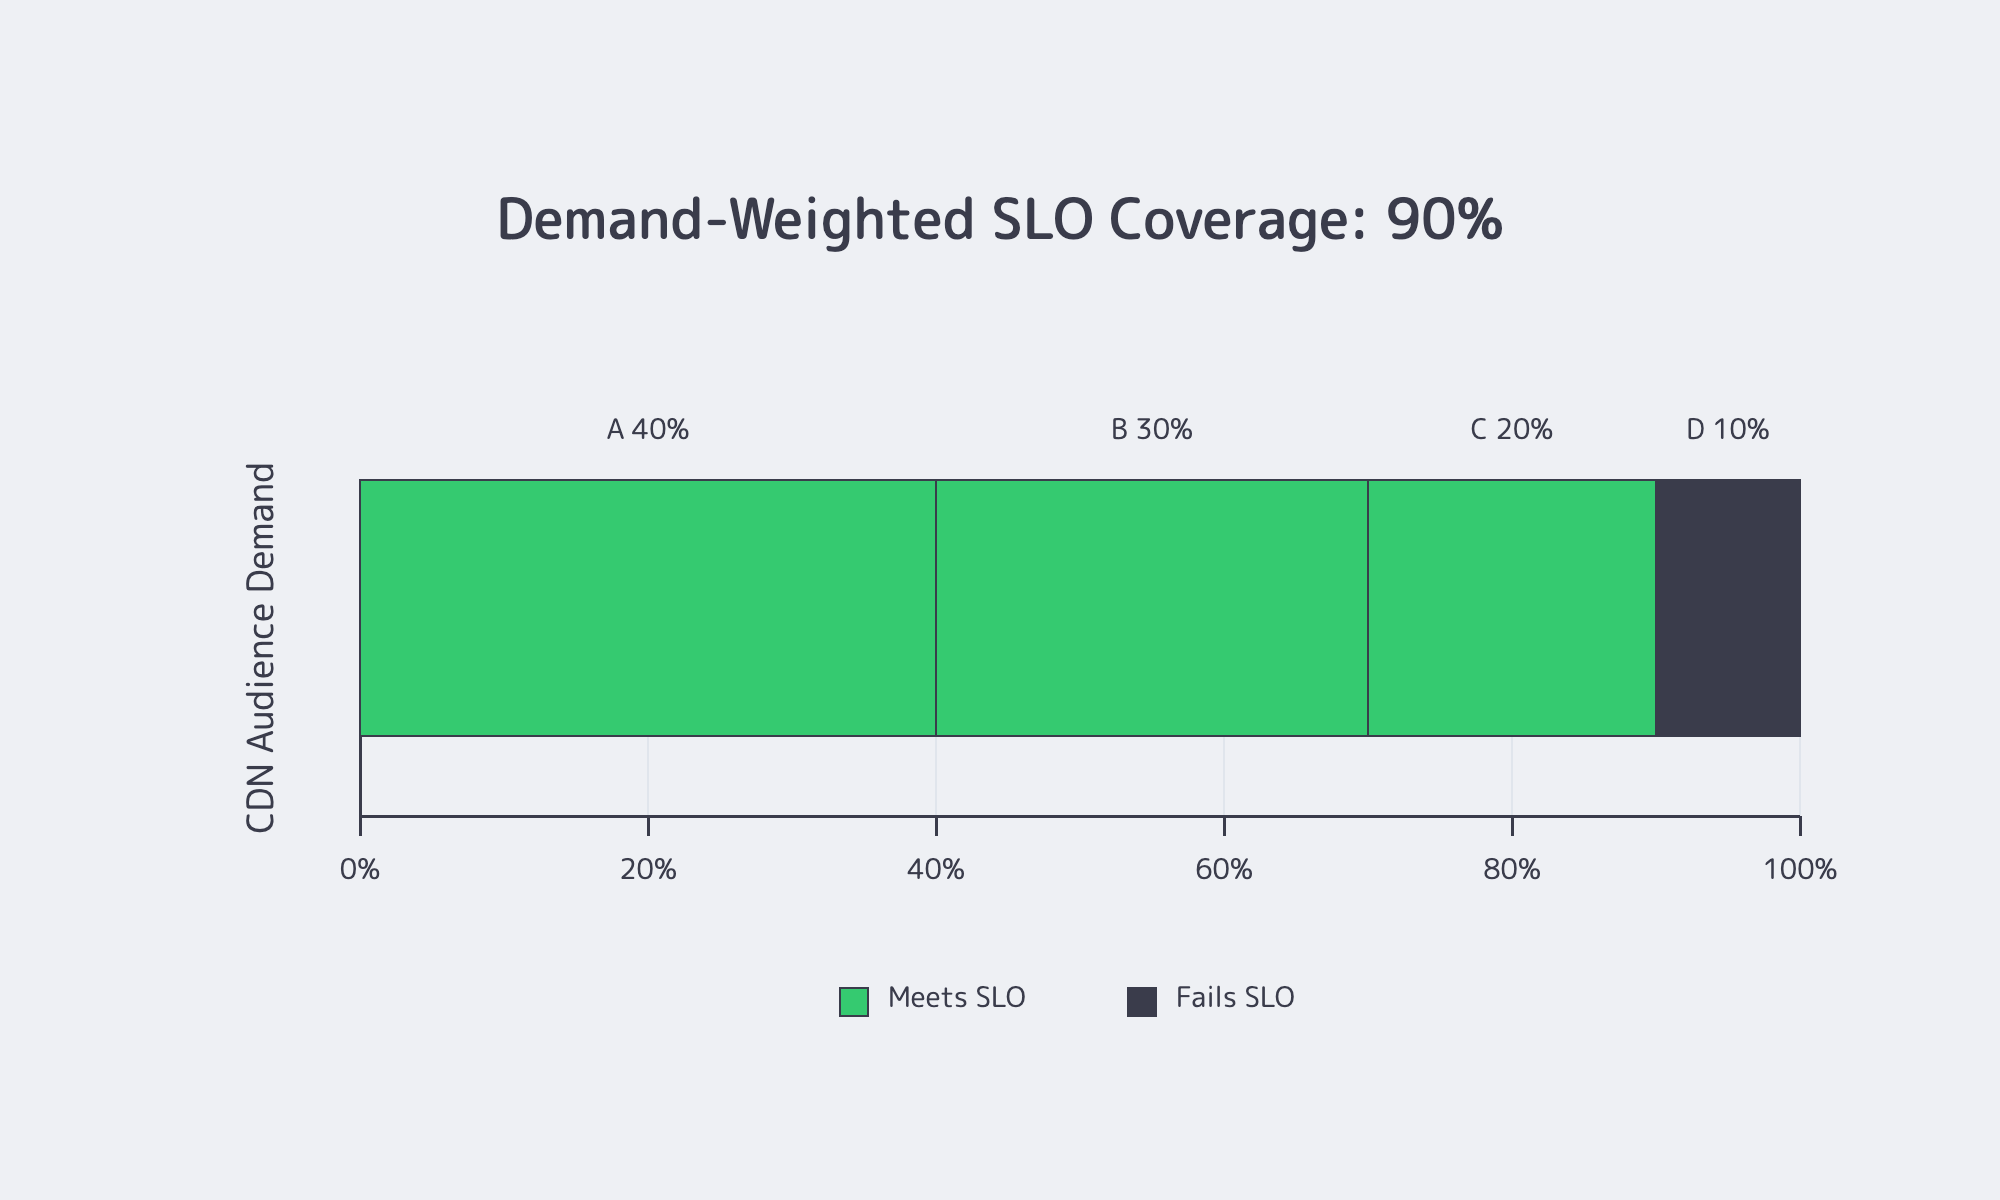
Suppose four segments represent 40%, 30%, 20%, and 10% of traffic. If the first three meet their performance targets and the fourth fails, effective demand-weighted coverage is 90%.
That result is more actionable than claiming coverage in four countries.
Define the pass condition using metrics relevant to the workload. An API may prioritize p95 response latency, while software distribution may require both acceptable TTFB and sustained transfer throughput.
Combine repeatable synthetic measurements with real-user monitoring and CDN logs. Include normal traffic, local peak periods, and representative spikes. Continue testing until the results capture the operating conditions relevant to the purchasing decision.
Melbicom CDN provides real-time analytics and raw logs that engineering teams can use to examine delivery behavior alongside synthetic and real-user measurements.
Choose a CDN Network by Measured Demand, Not Map Density
CDN selection should be an exercise in audience alignment, routing analysis, and capacity planning—not location counting.
A strong evaluation combines production traffic distribution, serving-PoP identification, interconnection evidence, peak-load testing, and demand-weighted SLO results. Repeat the assessment as audience geography changes.
The essential principles are:
- Count effective catchments, not map pins. Give coverage credit only when representative users reach an edge that meets their performance targets.
- Weight coverage by demand. Prioritize high-volume ASNs while separately protecting smaller, business-critical segments.
- Inspect interconnection. Request route-level evidence rather than assuming IXP presence guarantees efficient paths.
- Validate regional capacity. Test peak throughput and headroom, not just aggregate network capacity.
- Measure tail performance. Compare p95 and p99 latency, TTFB, throughput, and errors under equivalent conditions.
- Demand reproducible evidence. Combine synthetic testing, real-user telemetry, and delivery logs before making a purchasing decision.
A CDN network‘s value ultimately depends on how well its locations, interconnections, and available capacity match real audience demand. The most useful footprint is not necessarily the largest; it is the one that consistently delivers the required performance where the application needs it.
Match CDN Coverage to Your Audience
Compare Melbicom Premium and Volume CDN plans against your audience geography and delivery needs. Use real-time analytics and raw logs to assess delivery behavior.