
Every CDN owner eventually asks the same question: where does my traffic actually go? The Statistics view of each resource answers it with two panels: a Traffic by Country treemap that shows each country’s share at a glance, and a Top countries table with per-country requests, cache hit rates and status codes.
This tutorial shows how to read the treemap, how to filter and sort the table, and how to export the whole dataset as CSV for your own reporting.
Prerequisites
- A CDN resource already created. See Add your first CDN resource.
- Traffic already flowing through the resource: the country panels render only for periods that served requests. See Point your domain at the CDN.
- Client Area access to the package.
Step 1: Open the resource statistics
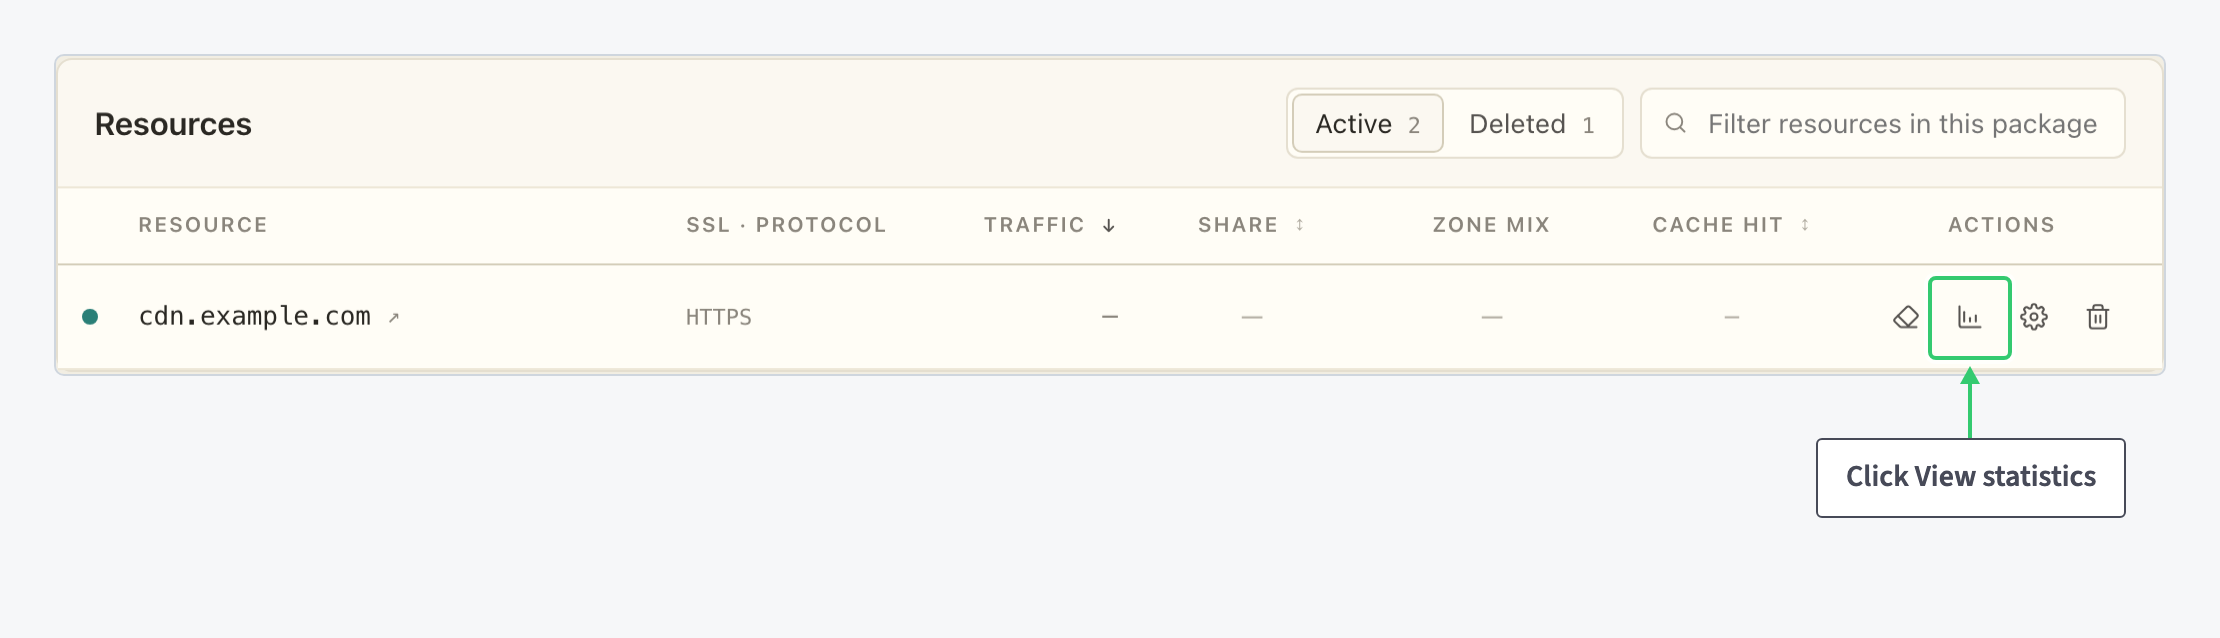
In the Resources table of your package, click the chart icon (View statistics) on the resource’s row, then pick the period you want to analyze with the date presets:
The country panels sit below the charts and describe the same period as everything else on the page. This tutorial covers only those two panels; for the rest of the view (presets, custom ranges, the Traffic, Requests and HIT % counters), see Monitor CDN traffic and cache performance.
Step 2: Read the Traffic by Country treemap
The treemap gives each country a rectangle sized by its share of the period’s traffic, with the name, the percentage and the volume inside. The biggest countries get named cells; the long tail collapses into numbered rank groups:

Rectangle area approximates traffic share, and small shares are lifted so every country stays legible; hover a cell for its exact percentage. Click a rank group to drill into it:

A breadcrumb trail above the treemap shows where you are and that group’s share of the total. Click All countries to zoom back out.
Step 3: Filter and sort the top countries table
The Top countries table turns the same data into numbers: traffic, requests, cache hit rate and 2xx to 5xx response counts per country, with the country’s zone shown as a pill. It opens ranked by traffic, showing the top ten with a Show all link in the footer:
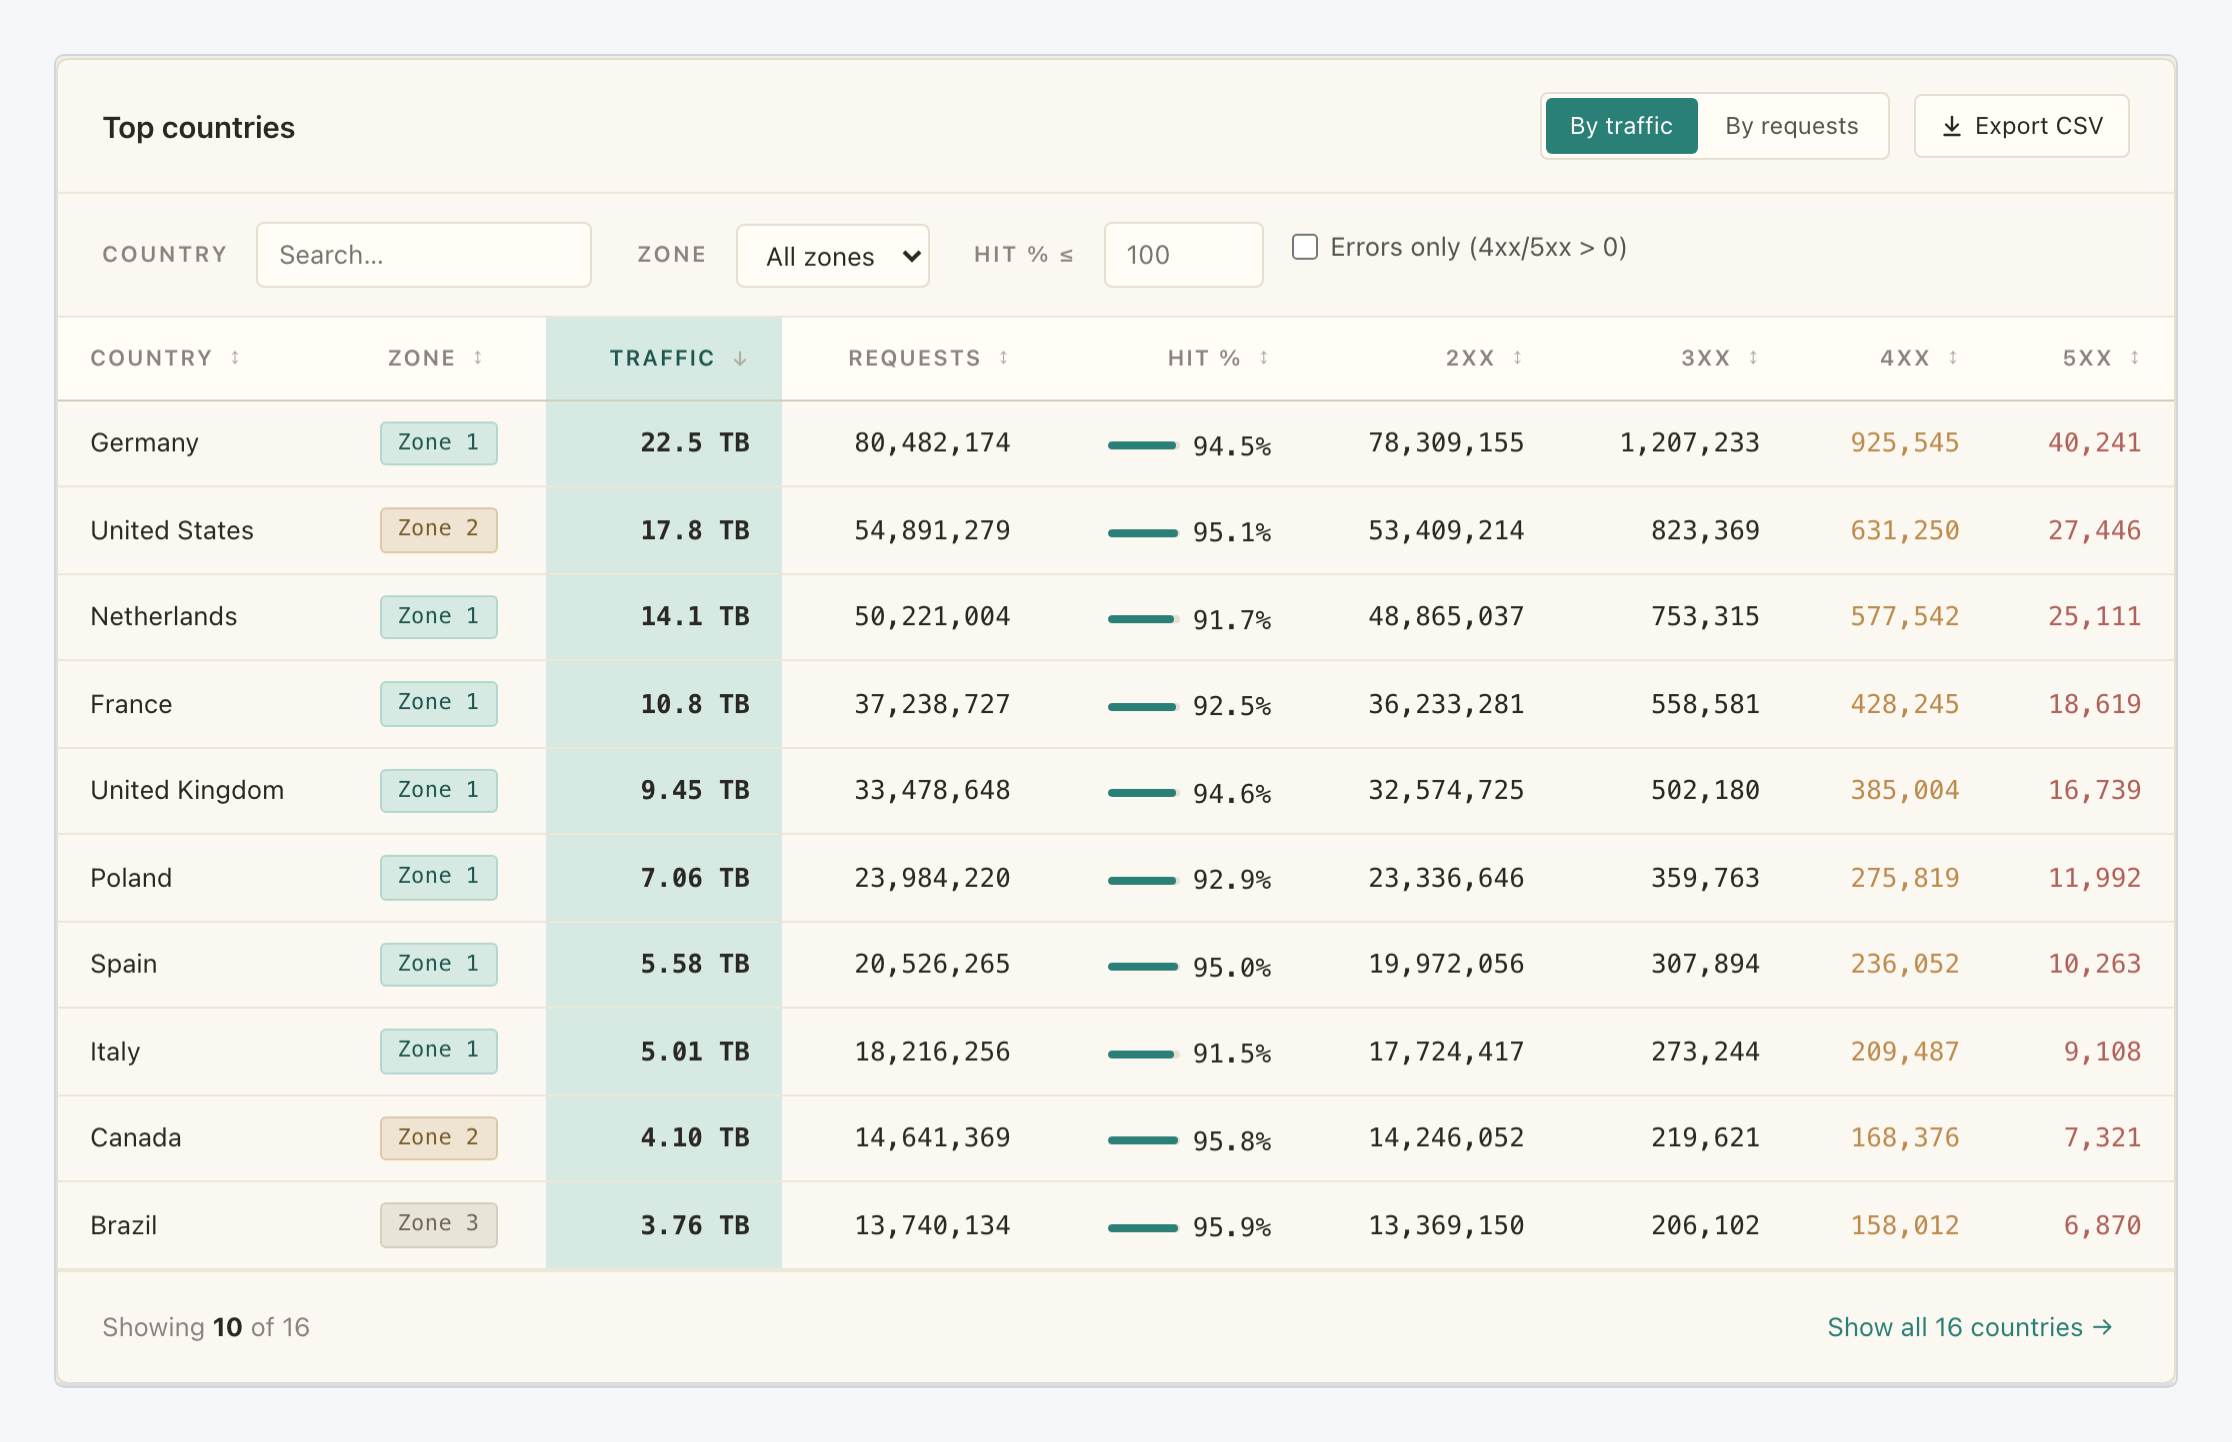
The controls above the table narrow it down:
| Control | What it does |
|---|---|
| By traffic / By requests | Ranks the table by data volume or by request count; the sort arrow moves to the chosen column. |
| Country | Search field. Filters rows by country name as you type. |
| Zone | Shows only the countries served from the selected zone. |
| Hit % ≤ | Keeps countries whose cache hit rate is at or below the number you enter, revealing poorly cached regions. |
| Errors only (4xx/5xx > 0) | Keeps countries that returned at least one 4xx or 5xx response. |
Filters combine, the footer counts the rows that remain, and a Clear filters button appears to reset everything in one click. Here the table is narrowed to a single zone:

Every column header sorts as well: click Hit % to rank countries by cache efficiency, or 5xx to put the countries seeing errors on top.
Step 4: Export the data as CSV
The Export CSV button next to the By traffic / By requests switch downloads the table as a spreadsheet-ready file, named top-countries-<date>.csv:

The file has one row per country with the same columns as the table: Country, Zone, Traffic, Requests, Hit %, and the 2xx, 3xx, 4xx and 5xx counts. Traffic is exported in raw bytes rather than the rounded display units, so the numbers stay precise in your own calculations. Active filters carry over: the file contains exactly the countries the table is filtered to, including any past the visible top ten.
What you’ve learned
You can now answer the “where does my traffic go” question from one screen: the treemap for the distribution of your audience, the Top countries table for exact per-country numbers, and its filters to isolate a zone, a poorly cached region or the countries seeing errors. When the on-screen view is not enough, Export CSV provides the raw dataset.
Two natural follow-ups: watch the same period’s totals and hit rate in the wider Statistics view, and if the traffic numbers themselves are the concern, enable compression to reduce them.