
Once your CDN resource serves traffic, you will want to know how much, and how much of it the cache absorbed. Each resource has a Statistics view for that: a date range you control through presets or a custom picker, and counters for Traffic, Requests and HIT % over the period.
This tutorial shows the two ways into the view and walks through its controls, including what a brand new resource sees before any traffic has flowed.
Prerequisites
- A CDN resource already created. See Add your first CDN resource.
- Your domain’s CNAME already pointed at the CDN: statistics stay empty until traffic flows. See Point your domain at the CDN.
- Client Area access to the package.
Step 1: Open the Statistics view
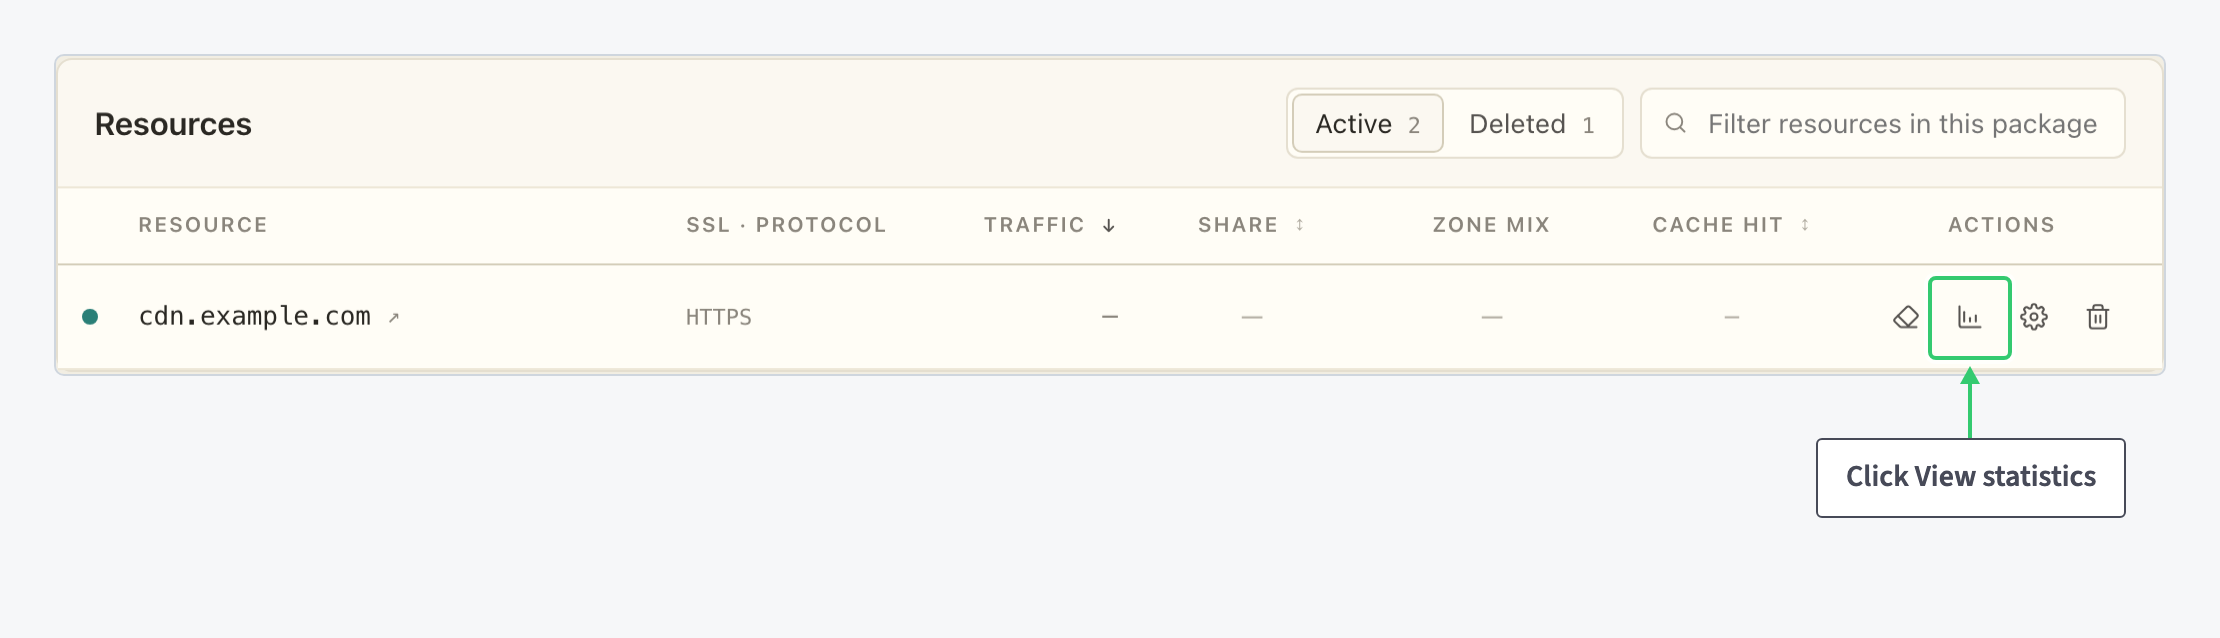
In the Resources table of your package, click the chart icon (View statistics) on the resource’s row. The table itself already gives you the summary columns Traffic, Share, Zone mix and Cache hit per resource; the Statistics view is where you pick periods and read the detail.
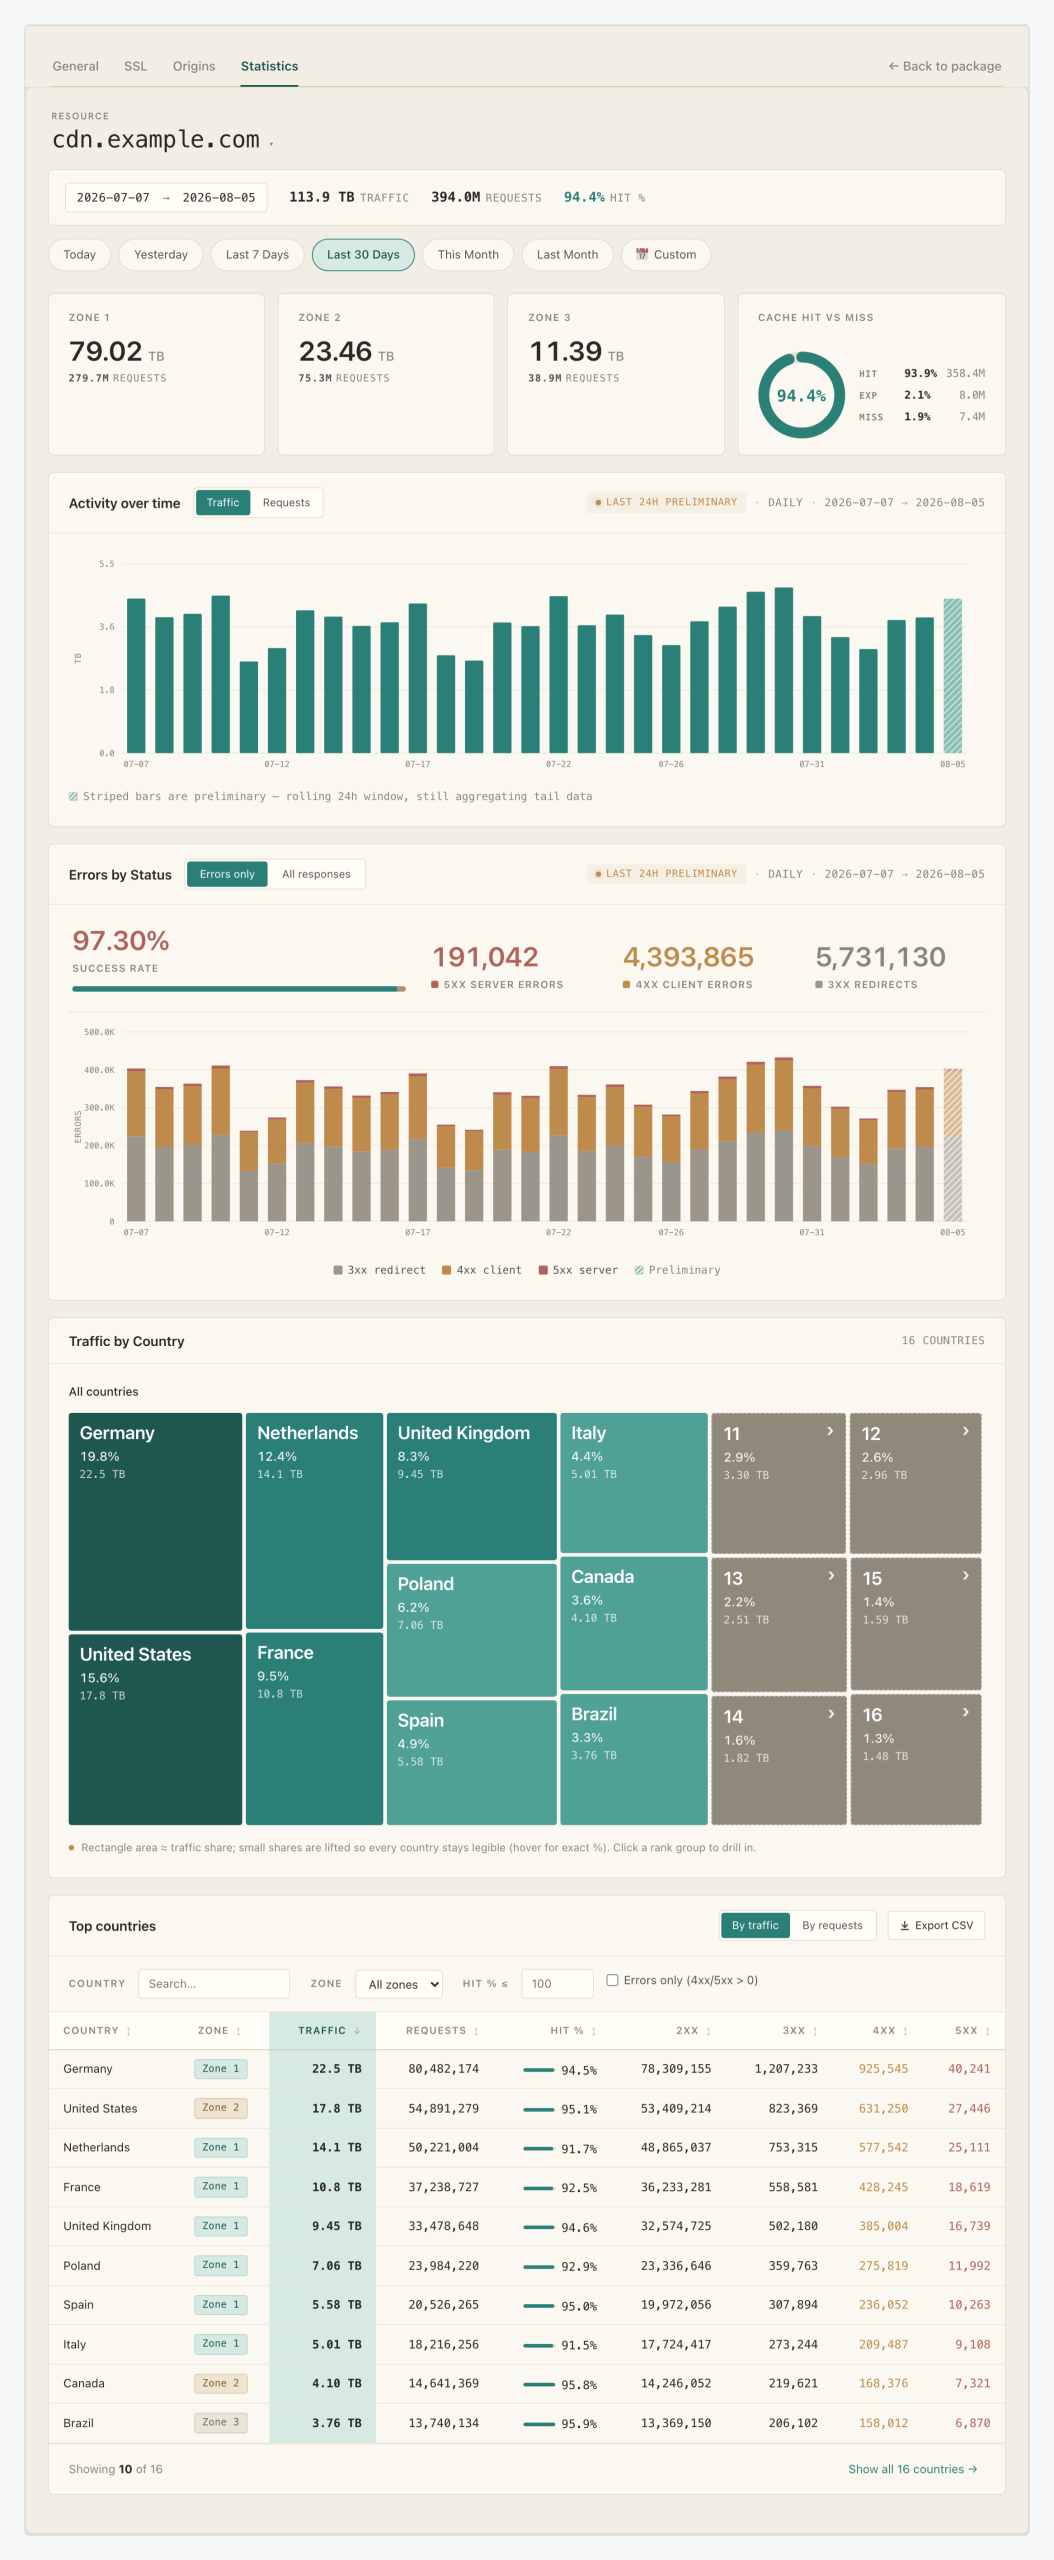
The same view is also the Statistics tab of the advanced settings, next to General, SSL and Origins, so you can jump to it while tuning the resource:
Step 2: Pick a period and read the counters

The strip at the top shows the active date range and three counters for it:
| Control | What it shows |
|---|---|
| Date range | The period being reported, for example 2026-08-01 → 2026-08-04. |
| Traffic | Data served over the period. |
| Requests | Requests served over the period. |
| HIT % | The share of requests answered from cache. |
Below the strip, preset chips switch the range in one click: Today, Yesterday, Last 7 Days, Last 30 Days, This Month (the default) and Last Month. A resource that served nothing in the period shows dashes in the counters and an empty state: “No traffic in this period”. Its advice is concrete: pick a wider range, or, if the resource is new, “make sure its CNAME is pointed so traffic can flow”.
Step 3: Set a custom date range
When no preset fits, the Custom chip opens a small dialog with From and To date fields. Set the two dates and click Apply to reload the counters for exactly that window, or Cancel to keep the current range:

What you can watch
You now know both ways into a resource’s Statistics view and what its controls do: presets or a custom window to frame the period, then Traffic, Requests and HIT % for that frame. The HIT % counter is the one to watch: it tells you how much work the cache removes from your origin.
To act on what you see, enable compression to reduce the traffic figure, and purge the cache when stale content, not volume, is the problem.