Keep dedicated server monitoring ahead of telemetry pressure

Run customer-operated metrics, dashboards, and alerting on isolated hardware sized for ingestion, cardinality, query concurrency, compaction, retention, and recovery headroom under production load.

Protected observability infrastructure monitoring system performance

Dedicated server hosting makes pressure attributable

Observability data ingestion
Trace ingestion pressure

Reserve CPU and memory for collectors, remote write, series creation, and recovery bursts, keeping pressure attributable.

Isolated observability stack
Isolate query and rule load

Keep query, dashboard, and rule load separate so ingest lag and latency remain measurable under concurrent work.

Storage retention capacity sizing
Size retention storage

Choose SSD or NVMe capacity from retention, compaction, backup, restore, and catch-up demand with usable headroom.

Regional node map placement
Plan telemetry paths

Match bandwidth and region to scrape traffic, remote write, replication, dashboard responses, backups, and notifications.

Available configurations
Need a Custom Build?
Filters
Clear all
Data center
Data center
CPU
CPU
CPU Brand
CPU Brand
RAM
RAM
Storage
Storage
from
up to
GPU
GPU
    Bandwidth
    Bandwidth
    Data Transfer
    Data Transfer
    Available configurations –
    CPU
    Memory
    Storage
    Network
    GPU
    Data center
    Price
    Show more

    Make observability pressure visible before it compounds

    Metrics collection is not one workload. Scrapes, remote write, series churn, recording rules, compaction, dashboards, and ad hoc queries peak at different moments under production load. Capacity must absorb bursts and catch-up work without allowing ingest lag, rule latency, or storage queues to turn the stack into an opaque failure domain.

    Melbicom provides isolated hardware with configurable CPU, memory, SSD or NVMe storage, bandwidth choices, and regional deployment options. Bare metal server hosting ties resource pressure to known nodes, so teams can test dashboard concurrency, retention work, alert evaluation, and recovery against measurable capacity under representative load.

    Your team owns collectors, time-series software, Grafana, Alertmanager, access controls, upgrades, backups, restores, and incident response. Assign node roles, set thresholds from production-like tests, and add capacity when ingest lag, query latency, compaction backlog, or recovery time crosses them. Capacity decisions remain explainable before incidents force the issue.

    Operator monitoring observability alerts and metrics

    Keep observability responsive under production pressure

    Use measured workload signals to guide capacity and recovery decisions.
    Lower sustained ingest lag
    Stable dashboard query latency
    Timely alert-rule evaluation
    Controlled compaction backlog
    Predictable retention headroom
    Tested recovery capacity

    Own the complete observability stack

    Choose capacity, placement, and support while your team owns every observability software decision.
    Isolated CPU and memory capacity
    Local SSD and NVMe choices
    Ready-to-deploy server configurations
    Customizable hardware configurations
    Bandwidth sized for telemetry load
    Africa, Asia, Europe, North America, and South America
    Customer-owned software lifecycle
    Customer-controlled security and access
    24/7 technical support for servers
    Measured thresholds for adding capacity
    Size your telemetry stack
    Share ingest, query, retention, and recovery signals to map a suitable configuration.
    Talk to an expert

    Workloads that shape observability capacity

    Observability data ingestion
    High-cardinality ingest

    Sustain scrapes, remote write, series churn, and recovery bursts while keeping ingest lag and memory pressure attributable.

    Statistics monitoring dashboard
    Dashboard query load

    Serve concurrent dashboards and ad hoc queries while keeping latency, storage pressure, and collector load measurable.

    Flashing alarm beacon
    Recording and alert rules

    Evaluate recording and alerting rules on schedule while ingestion, compaction, and dashboard traffic compete for resources.

    Storage retention capacity sizing
    Retention and compaction

    Size usable storage for retention, compaction overhead, temporary data, backups, restores, and recovery catch-up.

    Inter-DC network connection
    Federation and replication

    Plan federation, replication, and query load so upstream and downstream nodes keep recovery headroom measurable.

    Isolated observability stack
    Role-separated topology

    Separate collectors, storage, dashboards, or alerting when measured contention justifies distinct resource and failure domains.

    Verified database recovery
    Backup and restore tests

    Test backups and restores with production-like data to validate storage throughput, network capacity, and recovery time.

    Regional node map placement
    Regional telemetry paths

    Place collection or storage near monitored systems when telemetry paths, dashboard users, or restores require regional capacity.

    Operations guidance for observability teams

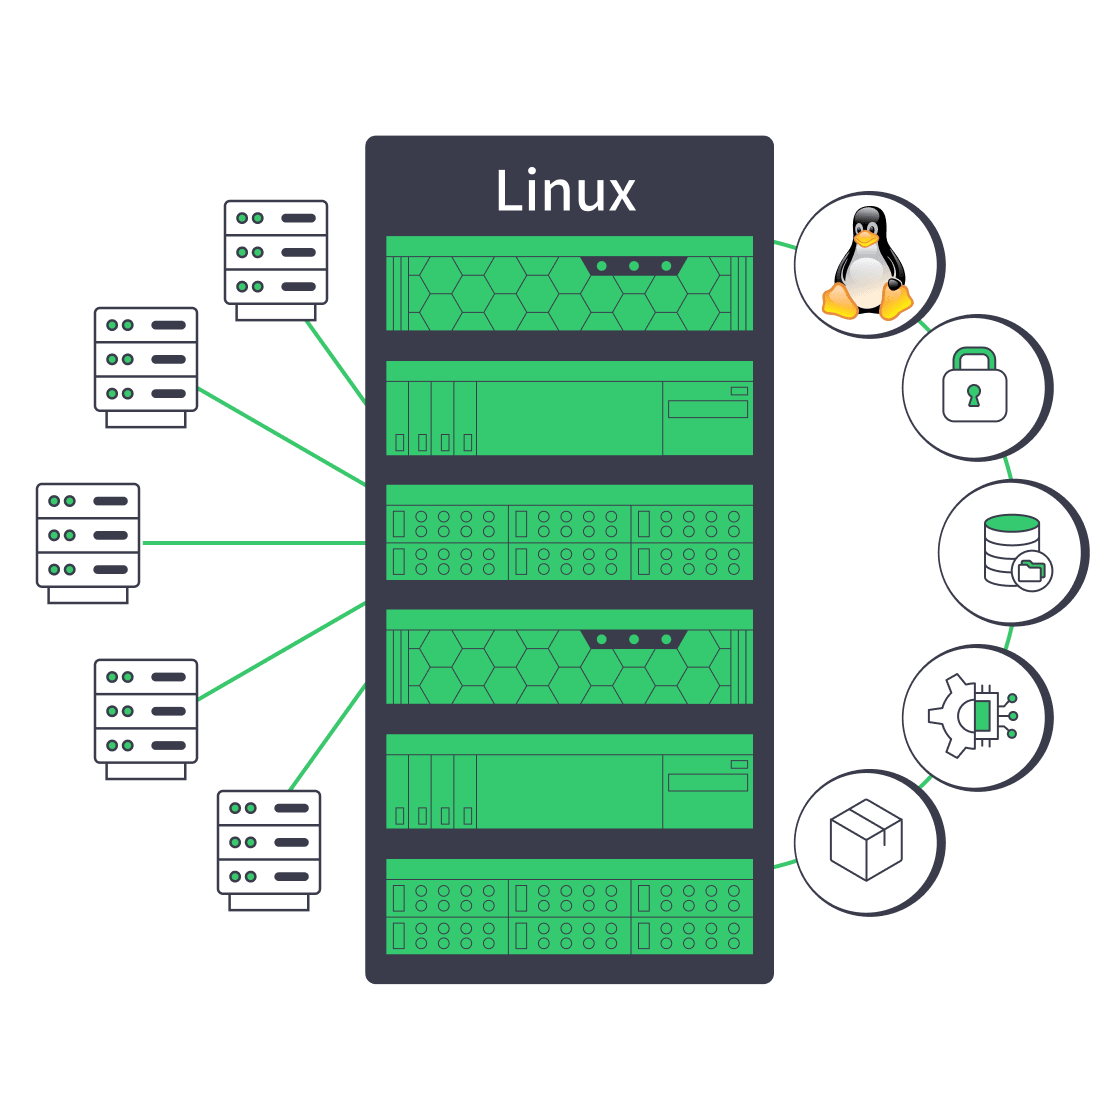
    Linux dedicated server with security, automation, storage, and network controls
    Linux Dedicated Server: Production Checklist for Control, Security, & Scale
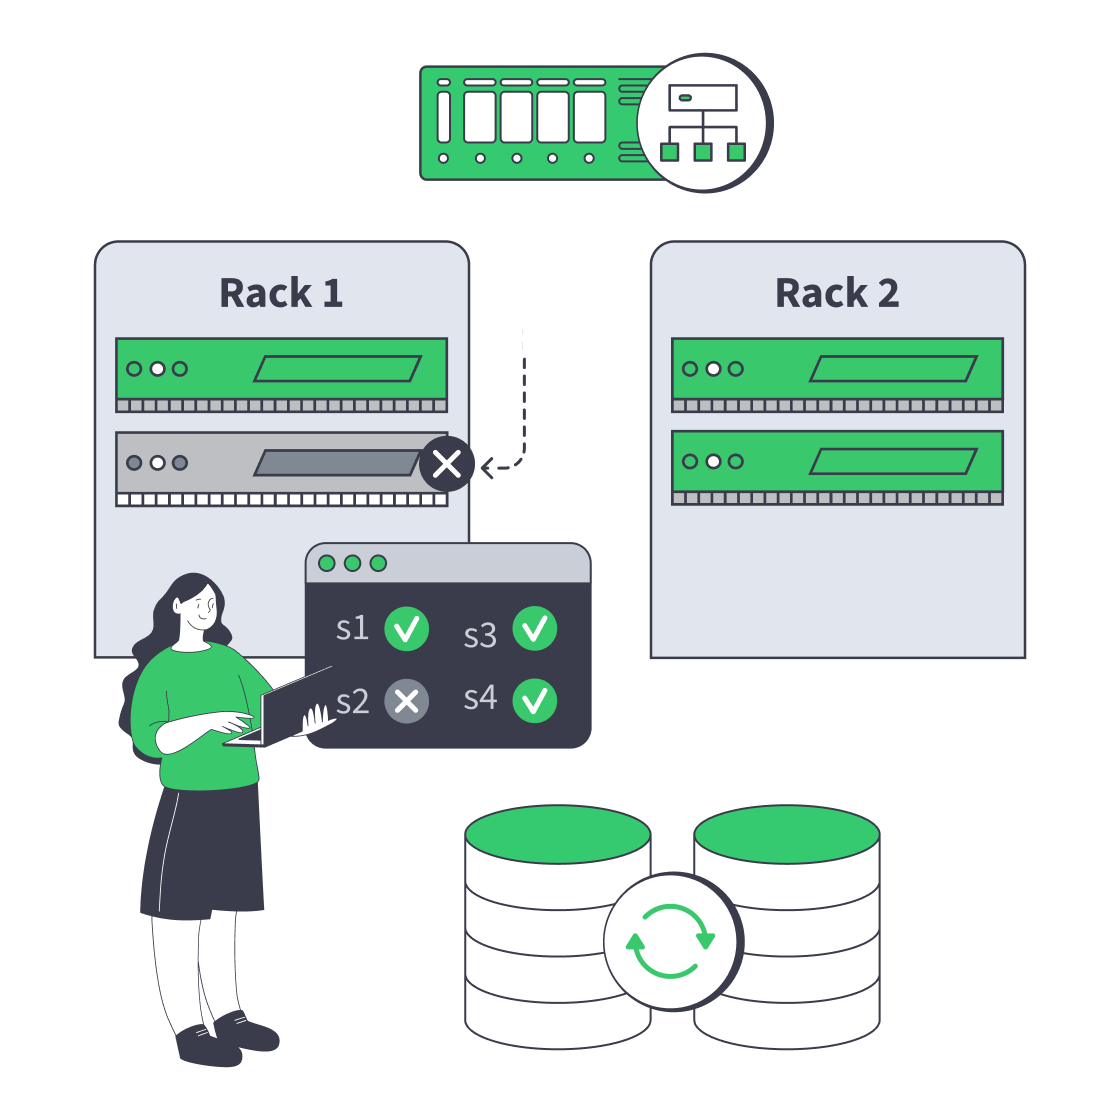
    Dedicated server cluster rerouting traffic after a node failure
    Designing High-Availability Clusters That Fail Safely
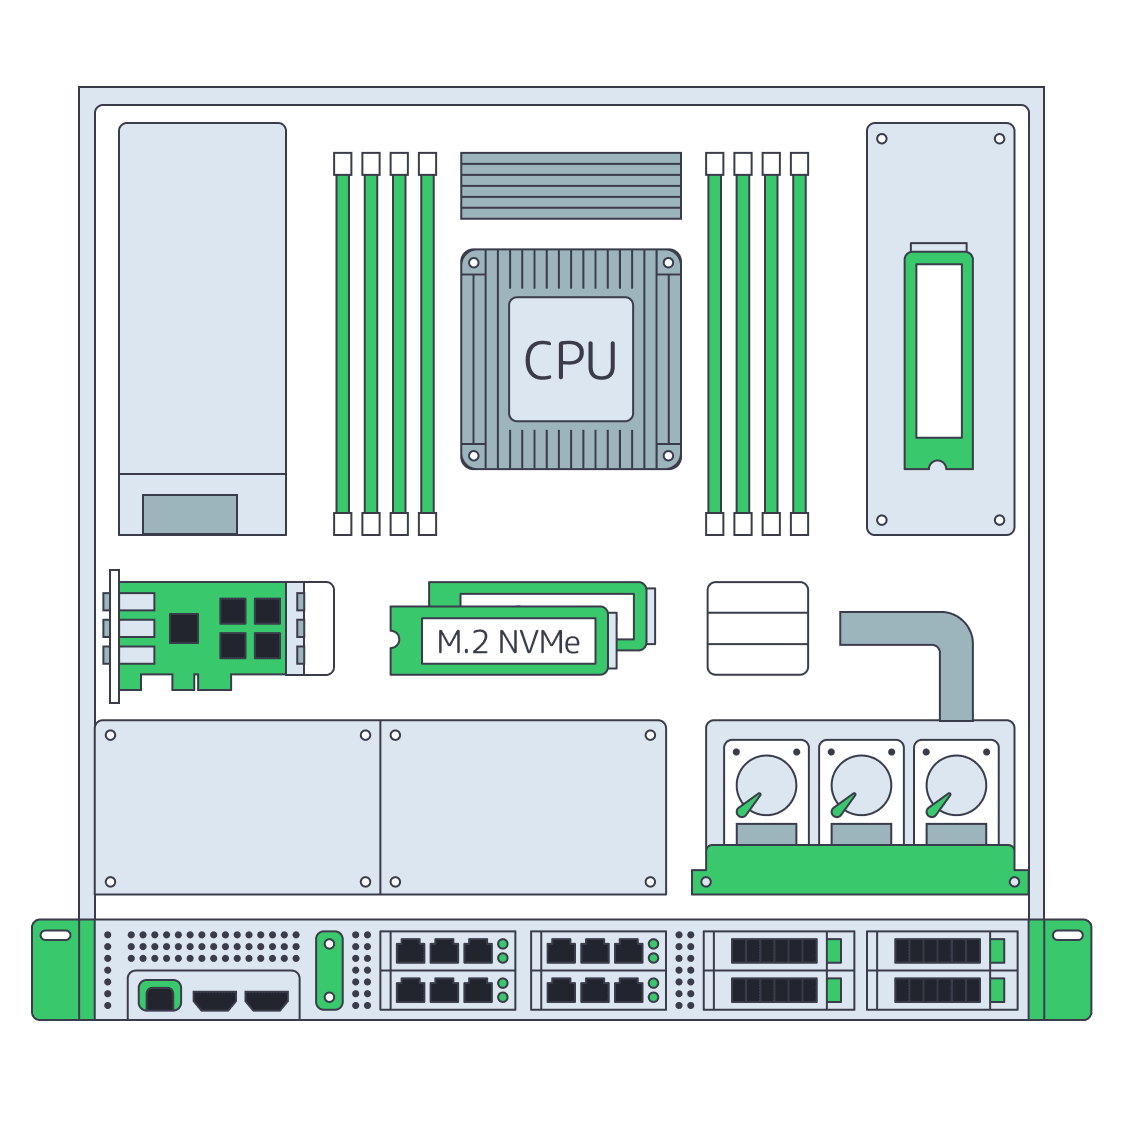
    Dedicated server BOM with CPU, RAM, NVMe, and NIC modules sized from workloads
    Spec Dedicated Servers From Workload, Not the Catalog
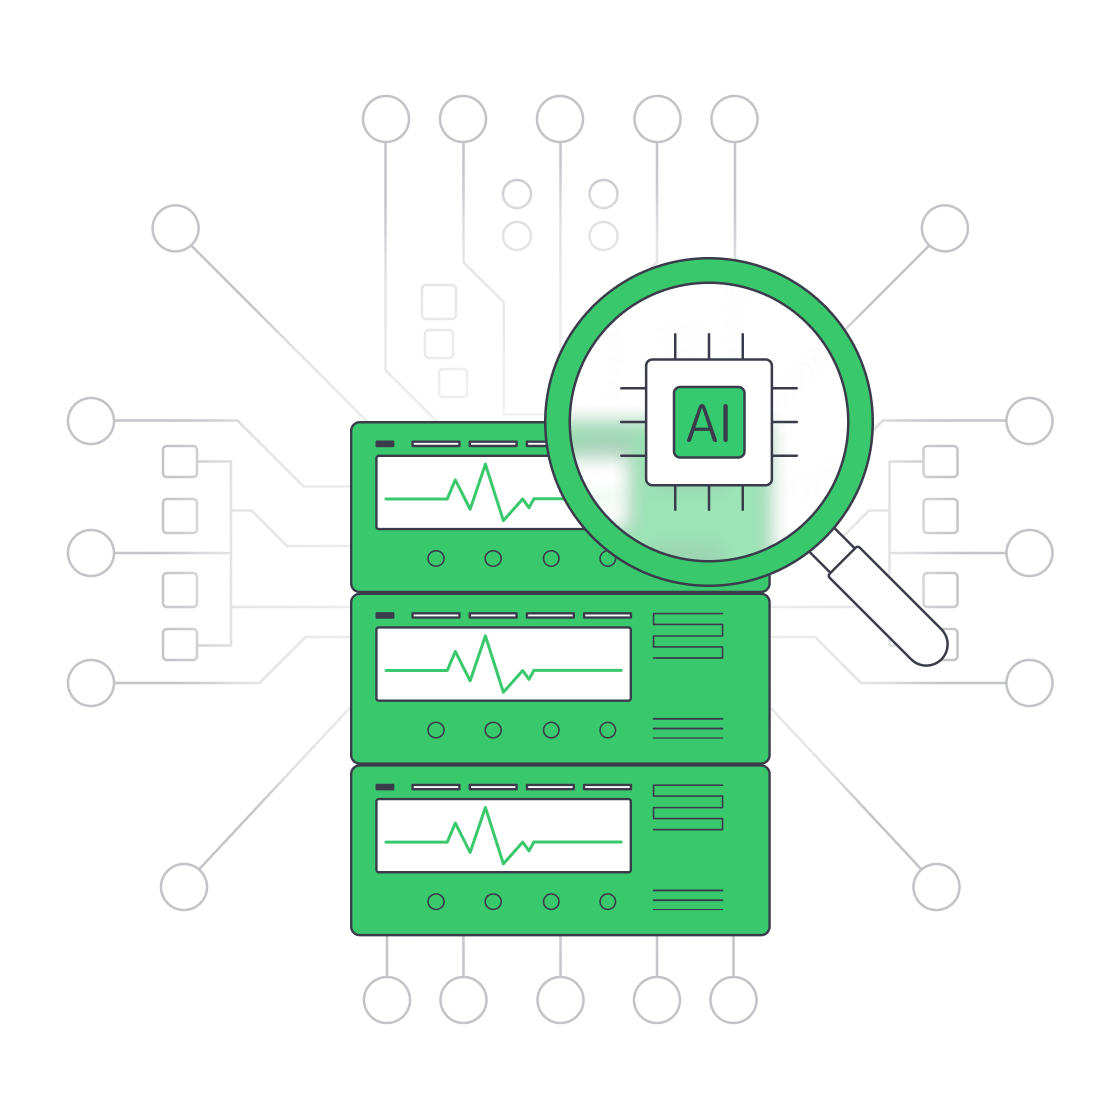
    Servers under AI magnifier displaying live metrics
    Building a Predictive Monitoring Stack for Servers
    More articles
    FAQ
    Who operates the observability software?
    What should we measure before sizing capacity?
    How should we plan for high cardinality?
    When does a dedicated server NVMe configuration help?
    Should dashboards and ingestion share one node?
    How do alert rules affect capacity?
    Which network traffic belongs in the capacity plan?
    How should we validate retention and recovery?
    Can Melbicom provide regional deployment options?
    What support does Melbicom provide?
    Start with measured load
    Create an account, compare configurations, and choose capacity around your tested telemetry demand.
    Create an account
    Plan the operating boundary
    Share ingest, retention, query, and recovery needs to map infrastructure fit with our team.
    Talk to an expert