
Blog
Building a Predictive Monitoring Stack for Servers
Downtime is brutally expensive. Enterprise Management Associates pegs the average minute of an unplanned IT outage at US $14,056, climbing to US $23,750 for very large firms.[1] Stopping those losses begins with smarter, faster observability—far beyond yesterday’s “ping-only” scripts. This condensed blueprint walks step-by-step through a metrics + logs + AI + alerts pipeline that can spot trouble early and even heal itself—exactly the level of resilience we at Melbicom expect from every bare-metal deployment.
Choose Melbicom— 1,400+ ready-to-go servers — 21 global Tier IV & III data centers — 39 CDN PoPs across 35 countries |
 |
From Pings to Predictive Insight
Early monitoring checked little more than ICMP reachability; if ping failed, a pager screamed. That told teams something was down but said nothing about why or when it would break again. Manual dashboards added color but still left ops reacting after users noticed. Today, high-resolution telemetry, AI modeling, and automated runbooks combine to warn engineers—or kick off a fix—before customers feel a blip.
What Dedicated Server Monitoring Includes
A dedicated server monitoring stack should combine high-resolution metrics, centralized logs, AI-assisted anomaly detection, and multi-channel alerts with tested runbooks. Metrics show resource pressure, logs explain causes, anomaly models reduce static-threshold noise, and alerts or self-healing actions turn signals into reliable incident response.
| Step | Objective | Key Tools & Patterns |
|---|---|---|
| Metrics collection | Stream system and application KPIs at 5-60 s granularity | Prometheus + node & app exporters, OpenTelemetry agents |
| Log aggregation | Centralize every event for search & correlation | Fluent Bit/Vector → Elasticsearch/Loki |
| AI anomaly detection | Learn baselines, flag outliers, predict saturation | AIOps engines, Grafana ML, New Relic or custom Python ML jobs |
| Multi-channel alerts & self-healing | Route rich context to humans and scripts | PagerDuty/Slack/SMS + auto-remediation playbooks |
Metrics Collection—Seeing the Pulse
High-resolution metrics are the vitals of a dedicated server: CPU load, 95th-percentile disk I/O, kernel context switches, TLS handshake latency, custom business counters. Exporters pull these numbers into a time-series store—most shops adopt the pull model (Prometheus scraping) for its simplicity and discoverability. Labels such as role=db-primary or dc=ams make multi-site queries easy.
Volume is real: a single node can emit hundreds of series; dozens of nodes create billions of data points per day. Tool complexity still reflects that reality: Grafana Labs’ 2026 survey names complexity/overhead as the top observability concern (38%) and reports that 65% of organizations are investing in both Prometheus and OpenTelemetry.[2] Consolidating feeds through OpenTelemetry or Alloy collectors reduces overhead and feeds the same stream to both dashboards and AI detectors.
Log Aggregation—Reading the Narrative
Metrics flag symptoms; logs give quotes. A centralized pipeline (Vector → Loki or Logstash → OpenSearch) fans in syslog, app, security, and audit streams. Schema-on-ingest parsing turns raw text into structured JSON fields, enabling faceted queries such as “level:error AND user=backend-svc-03 in last 5 m”.
Unified search slashes Mean Time to Detect; when an alert fires, a single query often reveals the root cause in seconds. Correlation rules can also raise proactive flags, such as repeated OOMKilled events on a container or a 502 surge before front-end CPU spikes.
Because Melbicom provides servers with up to 200 Gbps per server in global Tier III/IV sites, IT operations staff can design continuous log shipping with enough network headroom for production traffic.
AI Anomaly Detection Beyond Static Rules
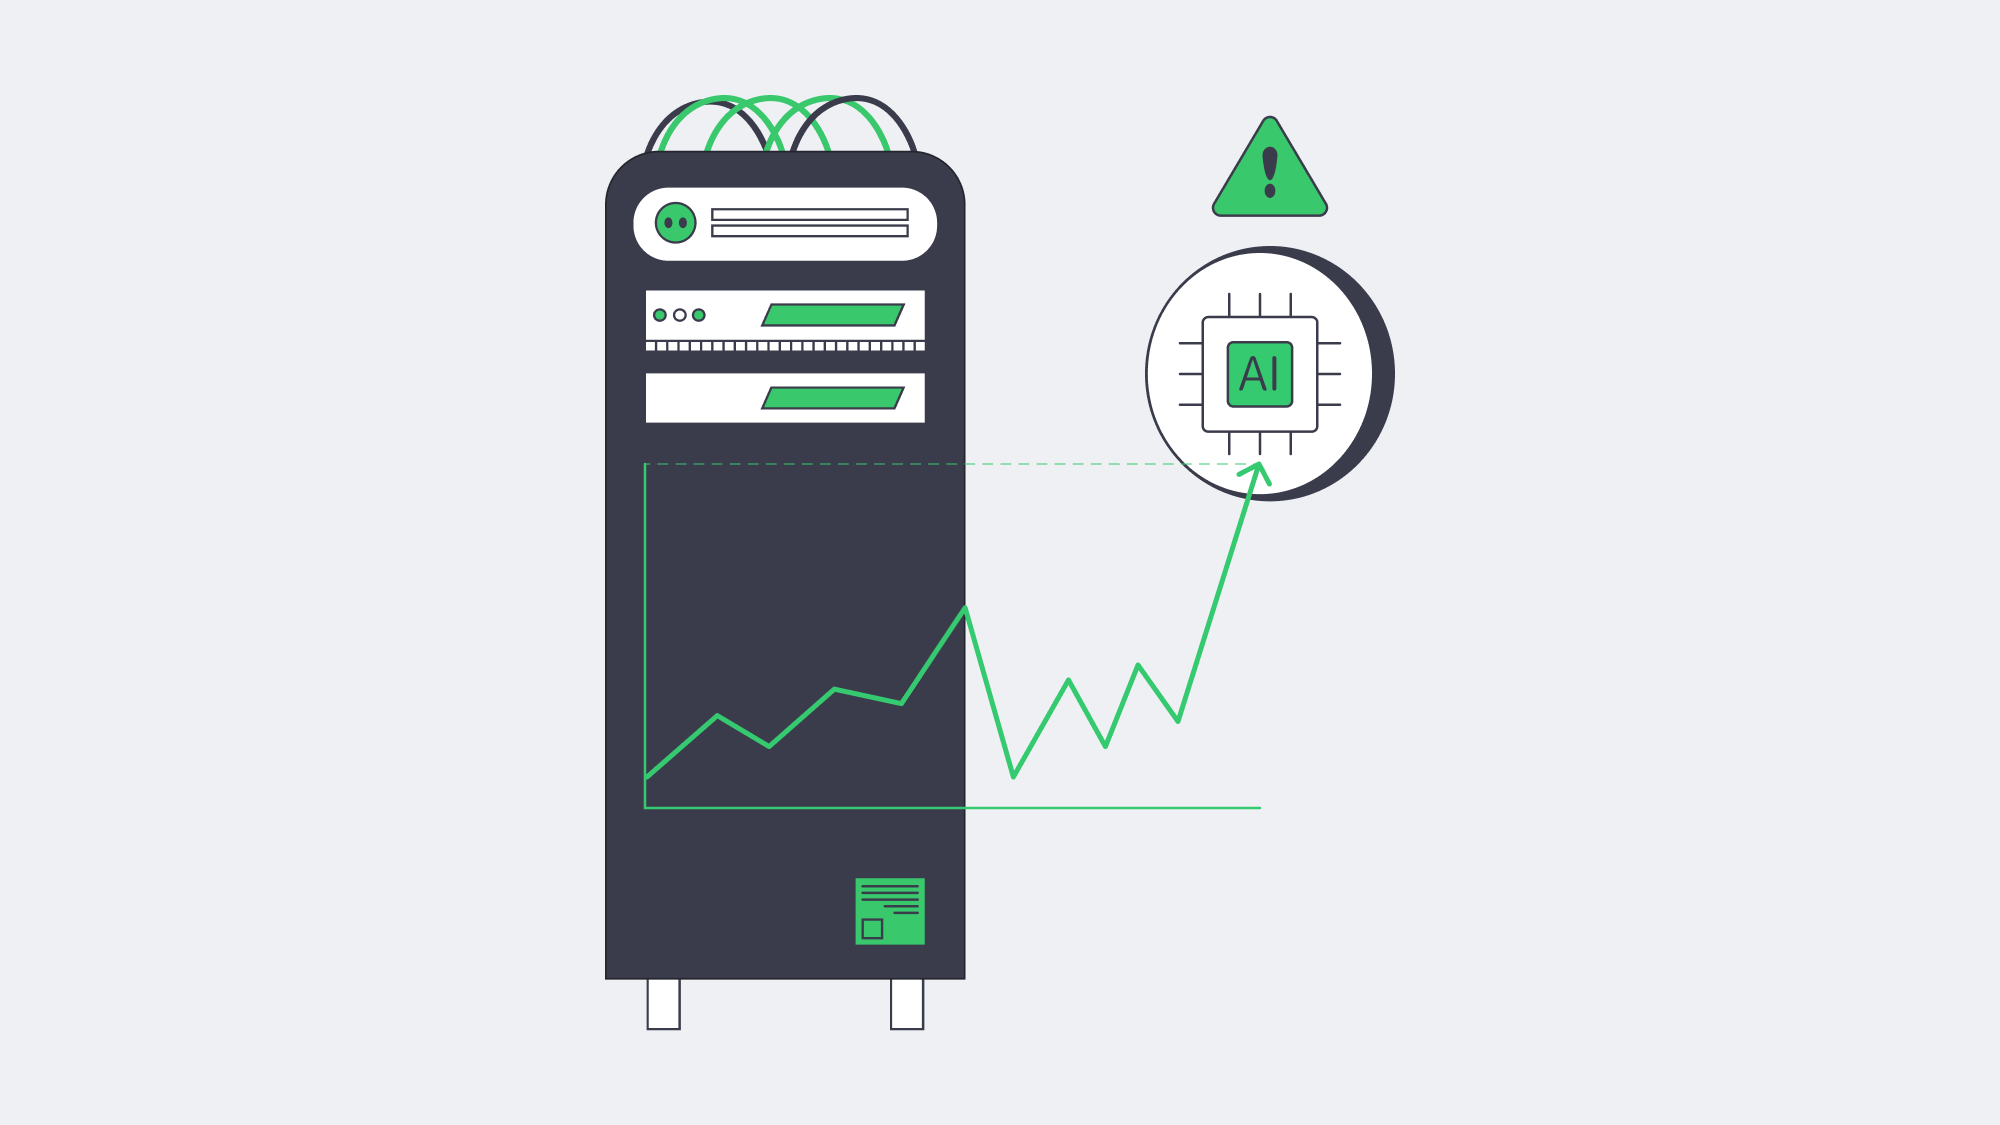
Static thresholds (“alert if CPU > 90%”) drown teams in noise or miss slow burns. Machine-learning models watch every series, learn its daily and weekly cadence, and raise alarms only when a pattern really breaks. EMA’s outage study shows AIOps users trimming incident duration so sharply that some issues resolve in seconds.[3]
- Seasonality-aware CPU: nightly backup spikes are normal; a lunchtime jump is not.
- Early disk failure: subtle uptick in ata_errors often precedes SMART alarms by hours.
- Composite service health: hairline growth in p95 latency + rising GC pauses + error-log rarity equals brewing memory leak.
Predictive models go further, projecting “disk full in 36 h” or “TLS cert expires in 10 days”—time to remediate before SLA pain.
Multi-Channel Alerts With Context
Detection is moot if nobody hears it. Modern alert managers gate severity bands:
- Info → Slack channel, threads auto-closed by bot when metric normalizes.
- Warn → Slack + email with run-book links.
- Critical → PagerDuty SMS, voice call, and fallback escalation after 10 m.
Alerts carry metadata: last 30-minute sparkline, top correlated log excerpts, Grafana explore link. This context trims guesswork and stress during overnight incidents.
New Relic’s 2025 Observability Forecast says many high-impact outages now cost $2 million per hour and that full-stack observability cuts that financial hit in half.[5] The right payload—and less alert fatigue—explains much of that edge.
Self-Healing Workflows for Routine Faults
Once alerts trust ML accuracy, automation becomes safe. Typical playbooks:
- Service restart when a known memory-leak signature appears.
- IPMI hard reboot if node stops responding yet BMC is alive.
- Traffic drain and container redeploy on Canary errors > threshold.
- Extra node spin-up when request queue exceeds modelled capacity.
Every action logs to the incident timeline, so humans can audit later. Over time, the books grow—from “restart Nginx” to “migrate master role to standby if replication lag stable”. The goal: humans handle novel problems; scripts squash the routine.
Distributed Monitoring Across Locations
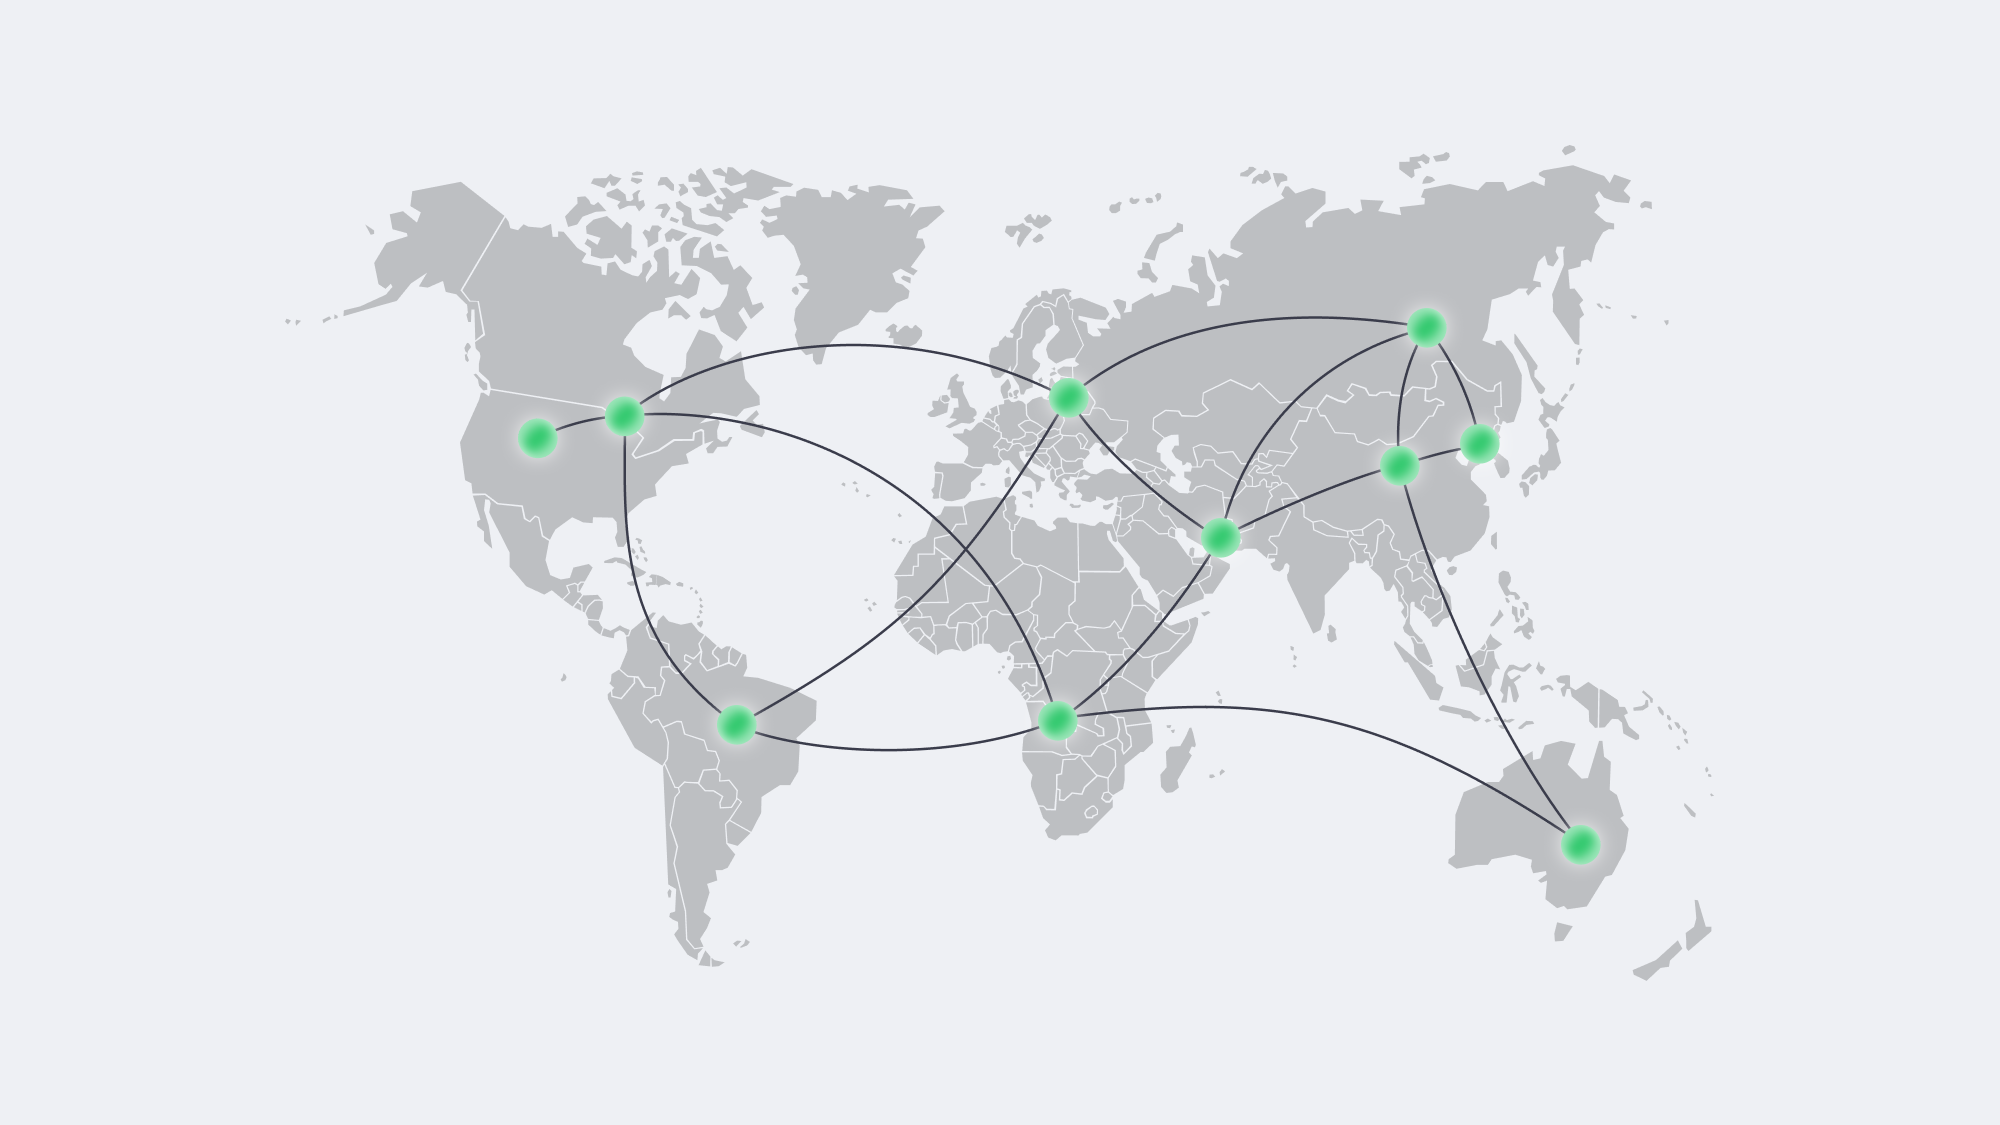
Metric latency to the collector can mask user pain from the edge. Dedicated nodes often sit in multiple regions for compliance or low-latency delivery. Best practice is a federated Prometheus mesh: one scraper per site, federating roll-ups to a global view. If trans-Atlantic WAN links fail, local alerts still trigger.
External synthetic probes—HTTP checks from Frankfurt, São Paulo, and Tokyo—verify that sites are reachable where it counts: outside the data-center firewall. Combined with Melbicom’s 21 locations and CDN pops across39 locations in 35 countries, ops teams can blend real user measurements with synthetic data to decide where to expand next.
Incident Economics—Why the Effort Pays
Tooling is not cheap, but neither is downtime. EMA’s 2024 outage-cost benchmark, published by BigPanda, shows every minute of unplanned IT downtime averages $14,056, and organizations with mature AIOps experienced a 30% decrease in outage frequency and cost.[4] Grafana’s 2026 Observability Survey adds that 77% of respondents saved time or money through centralized observability.[6] In plain terms: observability investment funds itself the first time a production freeze is shaved from an hour to five minutes.
Putting It All Together

Build the stack incrementally:
- Instrument everything—system exporters first, app metrics next.
- Ship every log to a searchable index.
- Enable anomaly ML on the full data lake, tune until noise drops.
- Wire multi-channel alerts with rich context.
- Automate the obvious fixes, audit, and expand the playbook.
- Test failovers—simulate host death, packet loss, disk fill—until you trust the automation more than you trust coffee.
Each phase compounds reliability; skip one and blind spots emerge. When executed end-to-end, ops teams shift from firefighting to forecasting.
Conclusion — From Reactive to Resilient
A modern monitoring stack turns servers into storytellers: metrics give tempo, logs provide narrative, AI interprets plot twists, and alerts assign actors their cues. Tie in automated runbooks and the infrastructure heals before the audience notices. Companies that follow this blueprint bank real money—downtime slashed, reputations intact, engineers sleeping through the night.
Launch Your Dedicated Server
Deploy in Tier III/IV data centers with up to 200 Gbps per server and 24×7 support. Start today and pair your new machines with the monitoring stack above for more resilient operations.