
Blog

Choosing a Solana RPC Host: Reproducible Request-Mix and NVMe Acceptance Tests
A Solana RPC hosting offer should pass more than a specification check. CPU, RAM, NVMe capacity, and network speed establish purchasing options, but they cannot prove that an endpoint will deliver fresh state under sustained load.
Solana’s RPC guidance recommends evaluating tail latency, errors, slot freshness, and WebSocket recovery. The purchasing challenge is turning those measurements into a reproducible acceptance test.
Solana RPC Servers– Dedicated compute – NVMe storage options – Regional deployment |
 |
Start the Solana RPC Hosting Benchmark With an Acceptance Contract
Before testing, normalize each hosting offer by server city, CPU model, physical cores, RAM, NVMe model and quantity, storage layout, network port, traffic terms, OS, and price.
A quote worksheet establishes what is offered, not what performs. The acceptance sequence should be:
Offer normalization → identical deployment → fixed workload → recorded measurements → pass/fail gates → price comparison.
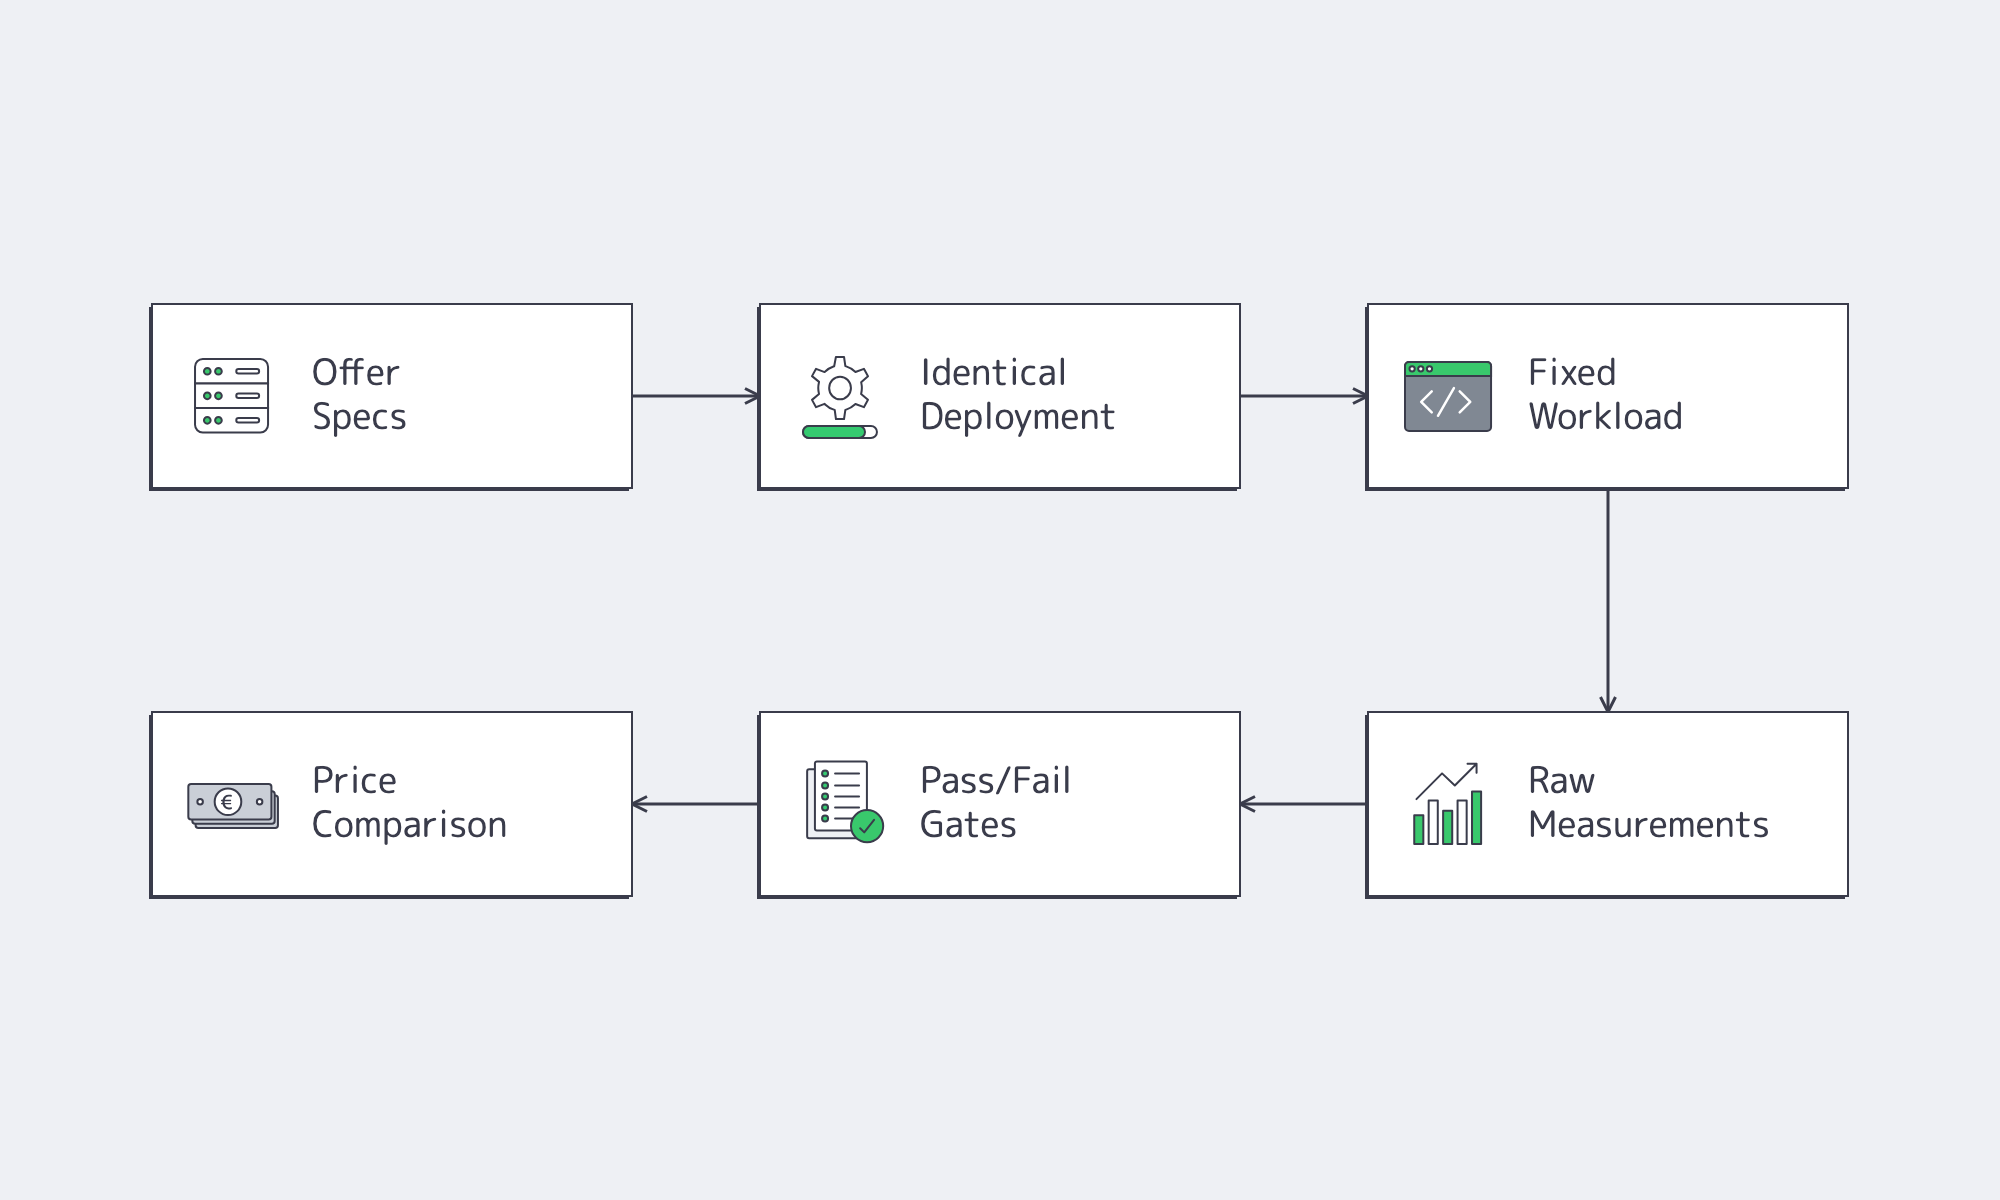
Choose acceptance thresholds from the application’s workload and operational requirements before testing, then hold them fixed across every shortlisted host. The fixture below demonstrates that process using one defined request mix and a set of example purchasing thresholds.
For freshness measurements, record slot differences and timestamps directly rather than converting slots to milliseconds using a fixed slot duration.
Which Request Settings Make a Solana RPC Hosting Benchmark Reproducible?
A reproducible Solana RPC hosting benchmark fixes RPC methods, payloads, commitment levels, client geography, arrival rate, concurrency, timeouts, and software versions before testing. Run three identical steady-state trials and a 24-hour finalist soak. Every shortlisted host must receive the same workload, with timestamped conditions, recorded generator capacity, and unchanged acceptance thresholds throughout the evaluation.
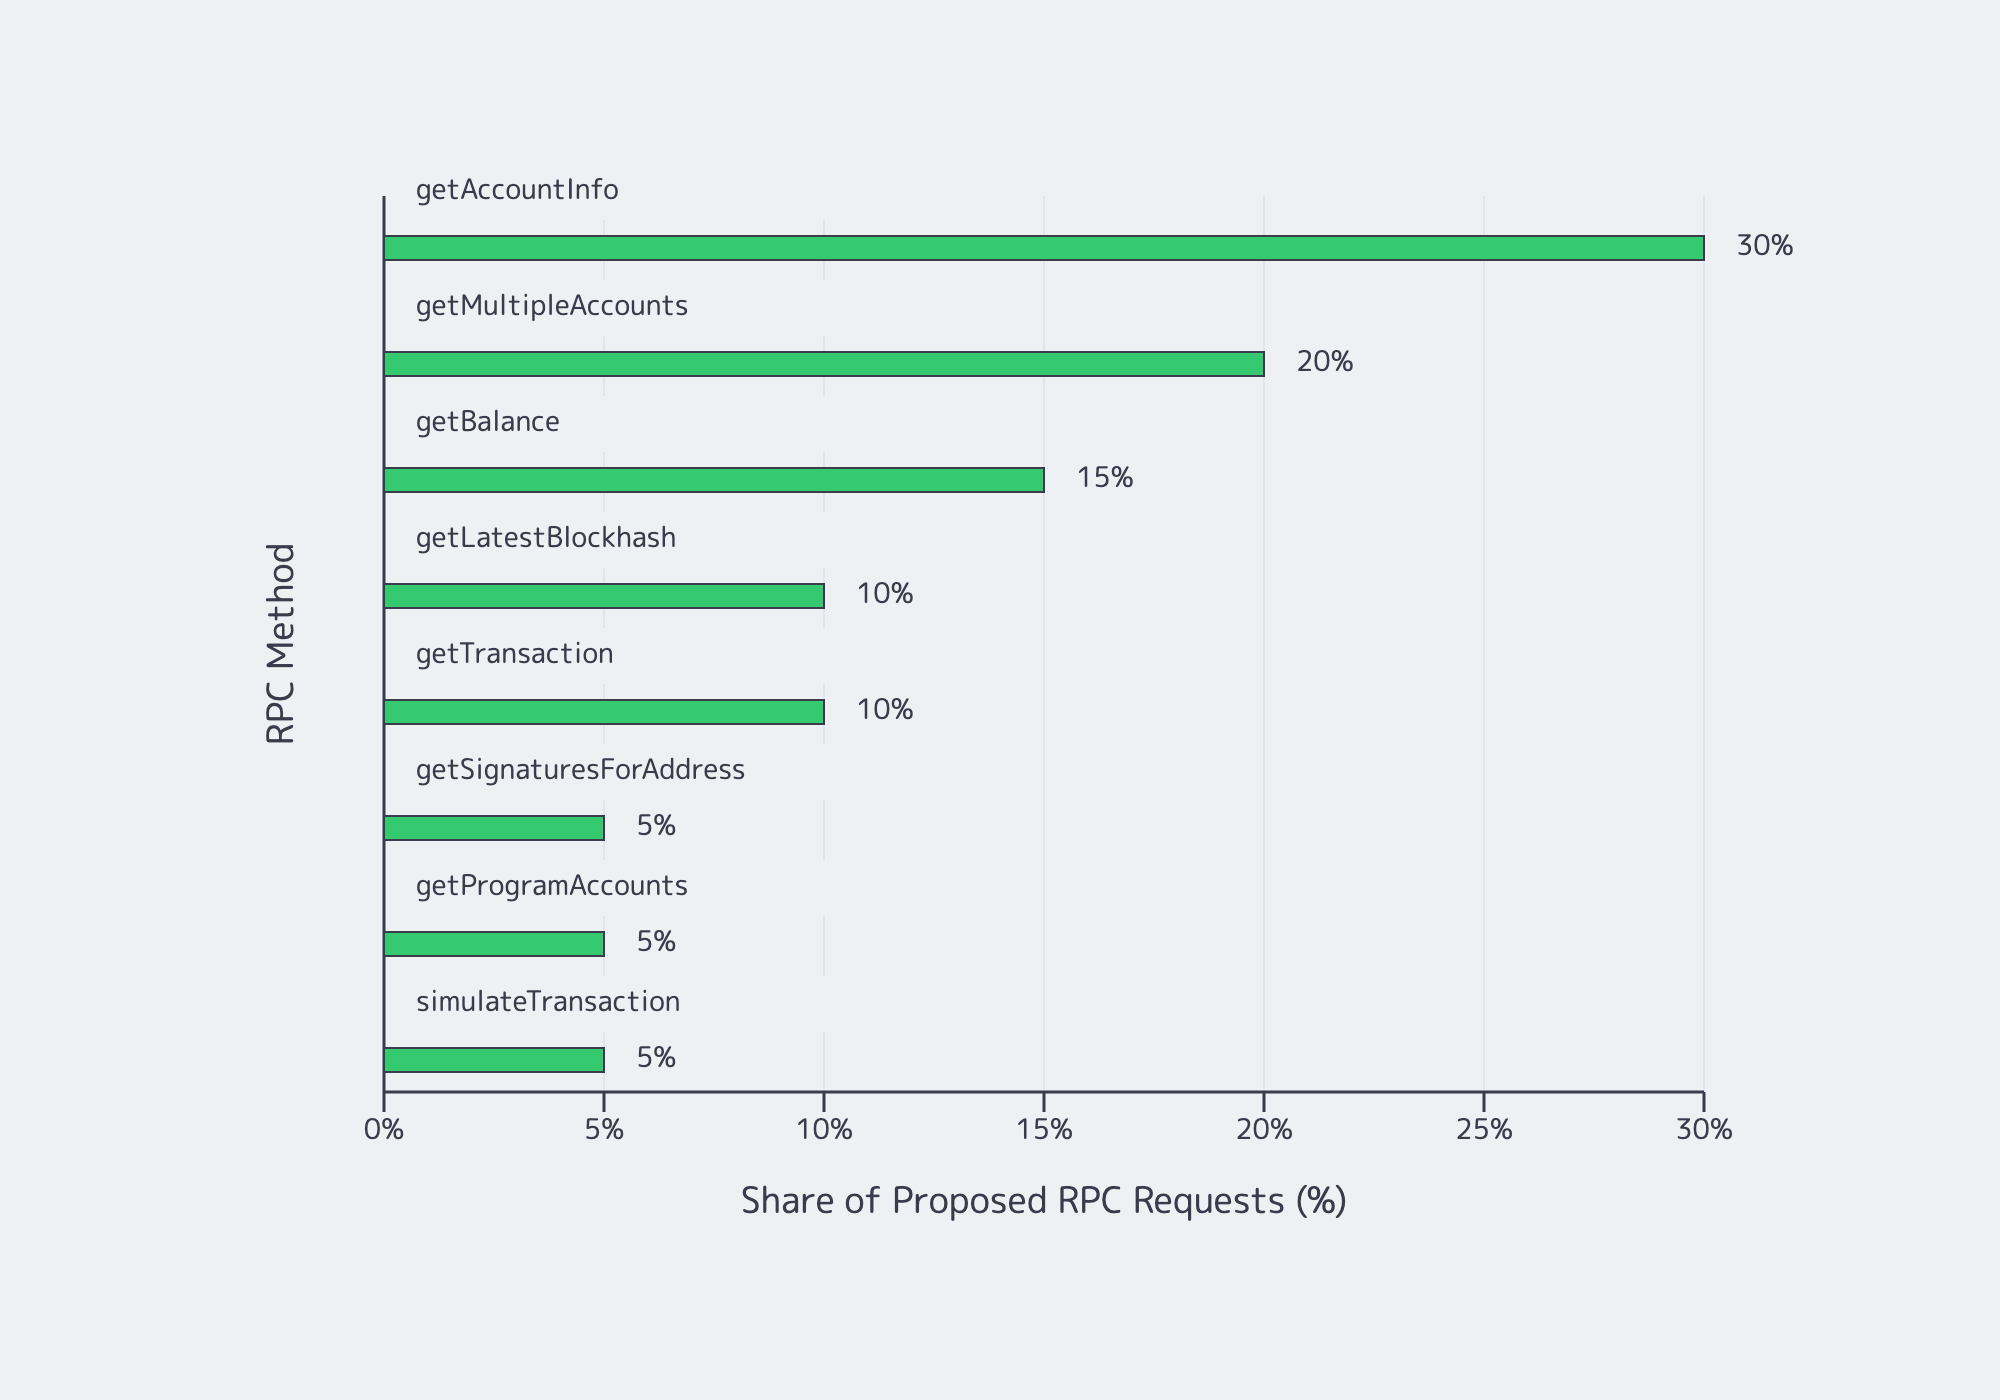
Solana RPC Request Mix Test
The example fixture combines lightweight reads, multi-account queries, historical lookups, heavier program queries, and transaction simulation.
Its fixed request distribution is 30% getAccountInfo, 20% getMultipleAccounts with 20 keys, 15% getBalance, 10% getLatestBlockhash, 10% getTransaction, 5% getSignaturesForAddress, 5% getProgramAccounts, and 5% simulateTransaction.
Use confirmed commitment except for getLatestBlockhash, which uses processed. Freeze encodings, filters, signatures, account keys, transaction templates, and response-size expectations. Solana’s RPC documentation explains why commitment settings cannot be treated as interchangeable. For getProgramAccounts, also freeze withContext, dataSlice, and minContextSlot if used; the latter sets a minimum context, not an exact historical slot.
The example manifest is:
fixture: solana-rpc-host-acceptance-v1
cluster: mainnet-beta

client:
  region: "<fixed-client-city>"
  generator_version: "<commit-sha>"

http:
  load_model: open_arrival
  target_rps: 500
  max_in_flight: 64
  request_timeout_ms: 5000
  keepalive: true
  warmup: 10m
  measured_steady_state: 45m
  repetitions: 3

  burst:
    target_rps: 1000
    max_in_flight: 128
    duration: 5m

  methods:
    getAccountInfo:
      weight: 30
      commitment: confirmed
      encoding: base64
    getMultipleAccounts:
      weight: 20
      accounts_per_request: 20
      commitment: confirmed
      encoding: base64
    getBalance:
      weight: 15
      commitment: confirmed
    getLatestBlockhash:
      weight: 10
      commitment: processed
    getTransaction:
      weight: 10
      commitment: confirmed
      encoding: json
      maxSupportedTransactionVersion: 0
    getSignaturesForAddress:
      weight: 5
      commitment: confirmed
      limit: 25
    getProgramAccounts:
      weight: 5
      commitment: confirmed
      withContext: true
      encoding: base64
      filters: "<frozen-filters>"
      dataSlice: "<frozen-slice>"
    simulateTransaction:
      weight: 5
      commitment: confirmed
      encoding: base64
      replaceRecentBlockhash: true
      sigVerify: false

corpus:
  path: corpus.json
  sha256: "<record-before-run>"

freshness_probe:
  interval: 1s
  commitment: processed

finalist_soak:
  duration: 24h
  target_rps: 500
  max_in_flight: 64
Use an open-arrival workload so slow responses do not silently reduce the offered request rate. As Grafana k6 explains, closed workloads can reduce throughput as response times increase. Record achieved arrivals, dropped iterations, and generator saturation. One iteration must represent one RPC request for iteration rates to equal request rates.
At 500 RPS, a 45-minute interval schedules 1.35 million requests. A method representing 5% receives 67,500 scheduled observations if the requested mix is achieved.
Preserve Timestamped Evidence
Use UTC timestamps for correlation and monotonic clocks for latency. Preserve raw samples or mergeable histograms, not averaged percentiles.
A minimal log schema is:
run_id,host_label,server_city,start_utc,
method,commitment,latency_us,http_status,
rpc_error,response_bytes,context_slot,
reference_slot,transport_error
Record software versions, configuration hashes, corpus checksums, timeouts, and unexpected JSON-RPC errors. Define whether latency includes connection establishment, and report successful-response percentiles alongside failures and timeouts.
HTTP 200 does not necessarily mean RPC success. Legitimate null responses must not automatically count as infrastructure failures; Solana documents such behavior for unavailable transactions.
Latency, Errors, Replay Lag, and NVMe Tests
A Solana RPC hosting benchmark should evaluate latency, errors, freshness, and sustained storage performance as separate acceptance gates. Define each gate from the application’s requirements, then apply the same limits to every host. A fast endpoint should not pass if stale state, failed requests, or unstable NVMe performance would prevent the application from operating correctly.
RPC p95/p99 Latency Testing
Report latency per method before calculating the mixed-workload distribution. A fast aggregate can conceal a failing expensive query.
Choose standard-read p95 and p99 limits from the application’s latency budget. Apply separate limits to expensive methods such as getProgramAccounts, whose response sizes and execution costs can differ substantially from simple account reads.
For Solana RPC freshness, query getSlot(processed) every second against synchronized, independent healthy references:
cluster_lag_slots =
median(reference_processed_slots)
– candidate_processed_slot
Preserve signed differences, including negatives, plus reference health and sampling timestamps. This measures relative RPC freshness, not internal replay completion.
Track the ingest-versus-processed-slot diagnostic separately:
ingest_processed_slot_delta =
max_shred_insert_slot – processed_slot
The signed delta is diagnostic because shred insertion and replay represent different states. Forks and sampling offsets can also affect interpretation. Ask for agreed internal replay telemetry if replay performance itself is a purchasing requirement.
A healthy getHealth response is insufficient: Solana’s health check depends on a configured slot-distance threshold.
Example Acceptance Matrix
The following matrix uses the workload defined above. Choose its example gates against the buyer’s application requirements before evaluating hosts.
| Gate | Example Test | Example Pass Criterion |
|---|---|---|
| Standard reads | Fixed mix, 500 RPS | p95 < 200 ms; p99 ≤ 500 ms |
| Mixed workload | 45-minute steady run; 1,000-RPS burst | Errors ≤ 0.1% steady, ≤ 0.5% burst; ordinary-method p99 ≤ 750 ms; getProgramAccounts p99 ≤ 2.5 s |
| RPC freshness | Processed-slot probes at 1 Hz | p99 positive lag ≤ 2 slots; no lag > 5 slots lasting ≥ 10 s |
| NVMe | 60-minute measured random I/O; 30-minute measured sequential write | Random-I/O p99 completion latency ≤ 5 ms; final throughput ≥ 90% of initial measured throughput; predefined I/O floors met; no new media errors or critical warnings |
| Reconnect | 100 controlled disconnect cycles | p95 first-attempt-to-all-acknowledgments ≤ 2 s; zero unreconciled gaps |
| Finalist soak | 24 hours at 500 RPS | All applicable mandatory gates pass |
Solana NVMe Acceptance Test
NVMe model names do not establish sustained performance. Use fio’s workload controls to fix queue depth, I/O size, read/write ratio, and duration.
Run the example only against isolated, preconditioned scratch storage, never a production ledger or accounts database. The four random-I/O jobs intentionally share the designated scratch file; document filesystem, RAID layout, firmware, and achieved queue depth.
# rpc-nvme-acceptance.fio
# EXAMPLE ACCEPTANCE WORKLOAD

[global]
filename=/srv/rpc-bench/fio-test.bin
size=256G
ioengine=libaio
direct=1
time_based=1
group_reporting=1
percentile_list=95:99:99.9
ramp_time=10m
write_bw_log=rpc-nvme-bandwidth
write_lat_log=rpc-nvme-latency
log_avg_msec=1000

[rand-mixed-4k]
rw=randrw
rwmixread=70
bs=4k
iodepth=32
numjobs=4
runtime=60m

[seq-write-1m]
stonewall
rw=write
bs=1m
iodepth=16
numjobs=1
ramp_time=10m
runtime=30m
With ten minutes of ramp-up per job section, the sequential test schedule takes approximately 110 minutes, excluding file preparation and preconditioning.
Compare the final ten measured minutes with the first ten after ramp-up using time-series logs. An aggregate fio summary cannot show degradation over time.
Record IOPS, bandwidth, p95/p99 completion latency, actual queue depth, CPU utilization, and temperature. Direct I/O bypasses normal buffered I/O where supported; it does not guarantee durable writes.
Set IOPS and bandwidth floors from the application’s storage workload before testing.
Capture NVMe health before and after, using a pinned nvme-cli version that supports the selected command:
sudo nvme list -o json > nvme-list.before.json
sudo nvme log smart /dev/nvme0 -o json \
  > nvme-smart.before.json

cat /proc/diskstats > diskstats.before.txt

fio rpc-nvme-acceptance.fio \
  --output-format=json \
  --output=fio-results.json

sudo nvme log smart /dev/nvme0 -o json \
  > nvme-smart.after.json

cat /proc/diskstats > diskstats.after.txt
The Linux NVMe documentation lists media errors, critical warnings, and thermal-management counters. New media errors or critical warnings fail the storage-health gate.
Validate Reconnect Behavior and Apply Pass/Fail Criteria to Shortlisted RPC Hosts
A shortlisted Solana RPC host should recover WebSocket subscriptions after controlled disconnections, restore notifications, and reconcile missed state over HTTP. Measure reconnect-to-resubscribe latency separately from total recovery time, and require every injected disconnect to end in a reconciled application state. Test recovery while the fixed HTTP workload is running.
Establish 20 persistent WebSocket connections with frozen subscriptions, including slotSubscribe. After five stable minutes, disconnect clients, wait five seconds, initiate reconnection, and re-register subscriptions.
Record four recovery intervals independently:
disconnect → handshake
first reconnect attempt → all acknowledgments
disconnect → first resumed notification
disconnect → HTTP reconciliation complete
The first, third, and fourth intervals include the intentional five-second hold. The example matrix’s two-second p95 gate applies only from the first reconnect attempt to all subscription acknowledgments, excluding that hold.
Repeat for 100 controlled cycles while the fixed HTTP workload is running. Verify new subscription IDs, resumed valid notifications, and completed reconciliation. Solana’s RPC guidance emphasizes that WebSocket notifications are not a durable event log, making HTTP reconciliation essential.
A connection reopening successfully does not prove that application state recovered.
Turn the Solana RPC Hosting Benchmark Into a Purchase Decision
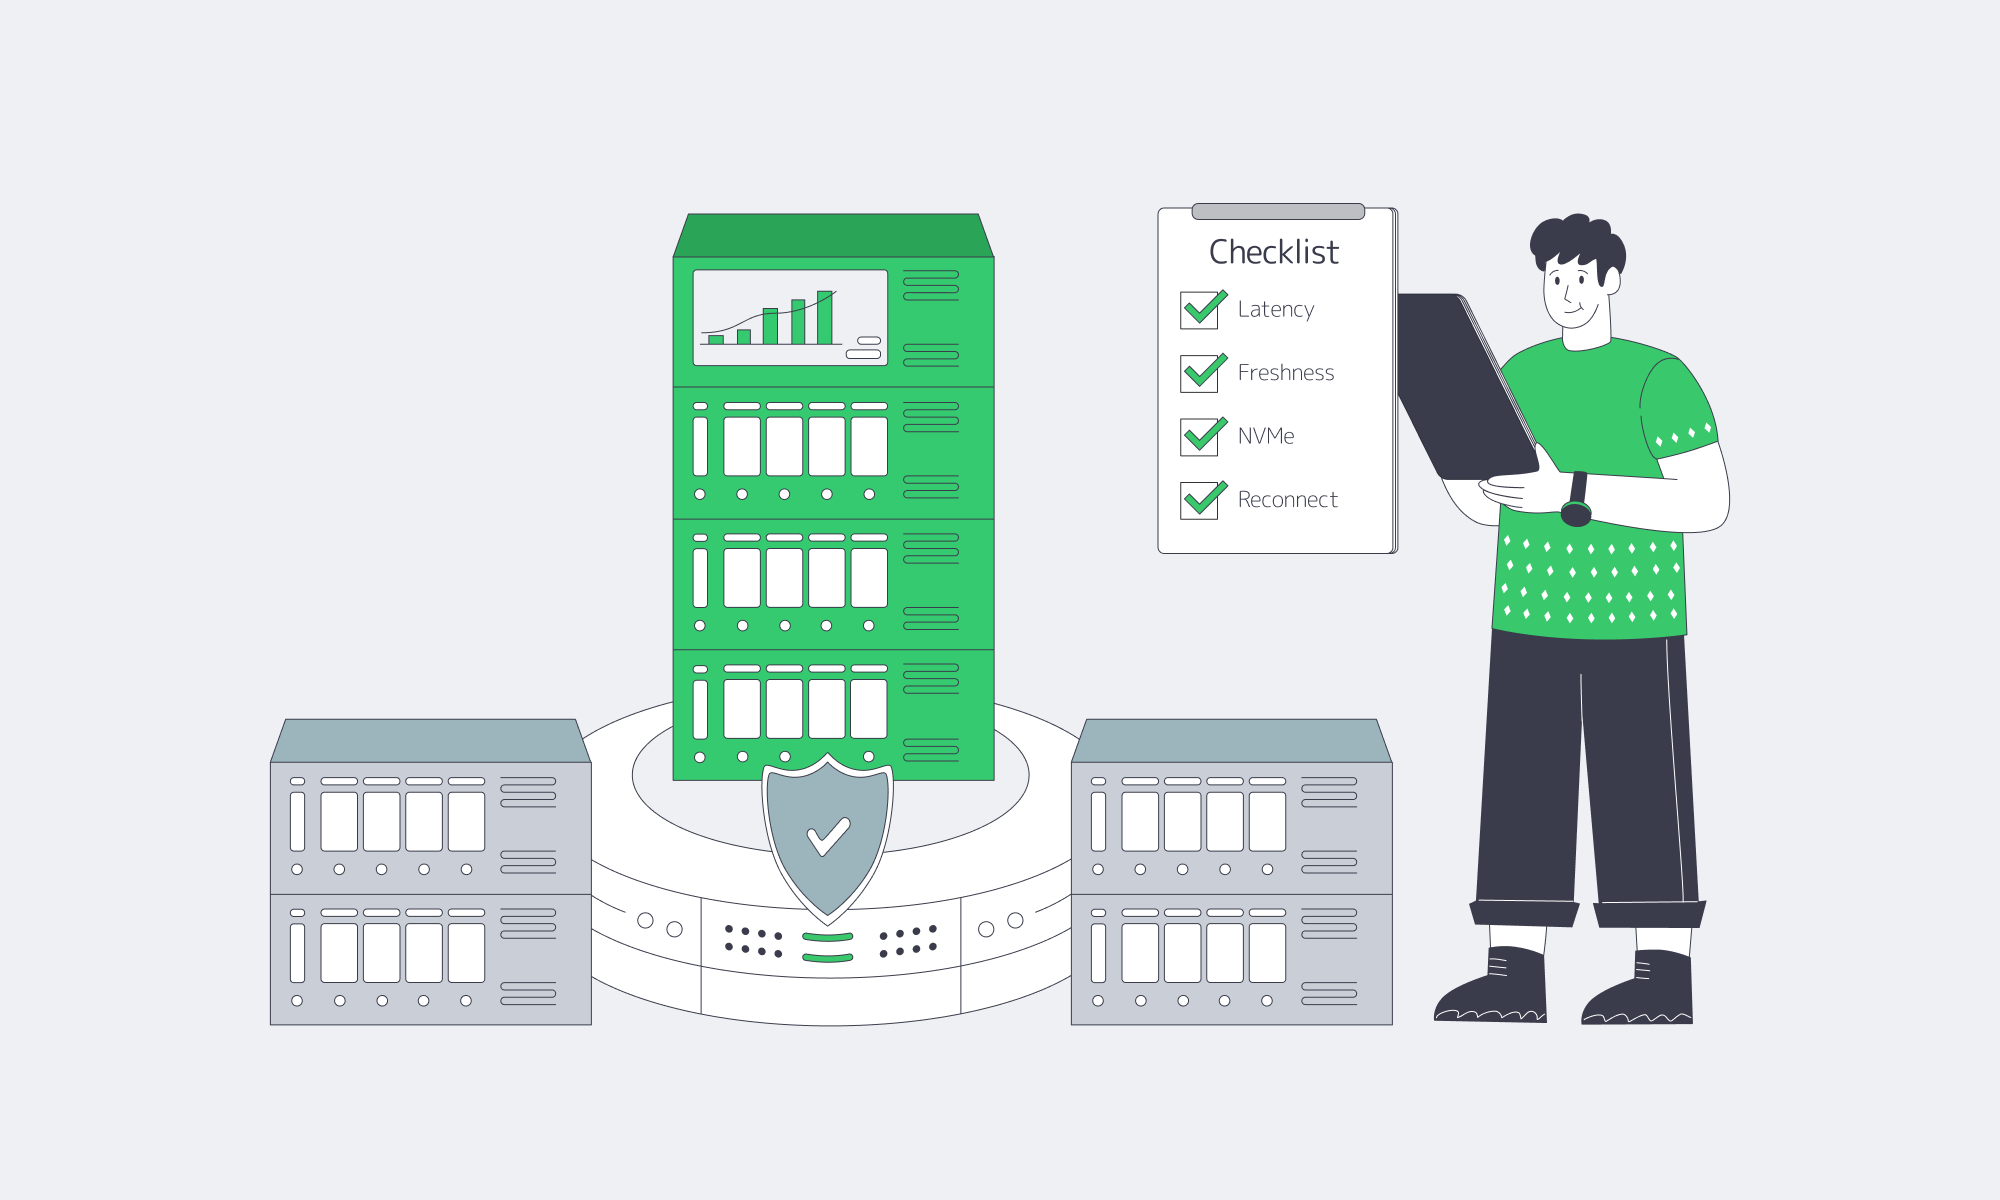
The strongest purchasing decision comes from rejecting failures before comparing costs. A low price cannot compensate for stale responses, excessive p99 latency, sustained storage degradation, or missing subscription state.
Use the acceptance results to make practical decisions:
- Reject inconsistent performance: A configuration that passes only one of three trials should not advance based on its best result.
- Investigate freshness independently: Low RPC latency with persistent slot lag calls for replay and ingestion diagnostics, not simply a faster network-port quote.
- Require sustained-storage evidence: Accept NVMe performance only when time-series data, health logs, and the agreed workload floors support it.
- Treat reconnect correctness as mandatory: Fast acknowledgments cannot compensate for missing application state.
- Compare costs after eligibility: Rank passing configurations by measured application-region latency, operational fit, and total cost.
This approach also supports expansion: a new location can be evaluated using the same fixture without reinventing the purchasing criteria.
Every acceptance report should preserve the offer worksheet, exact test conditions, raw logs, observed outcomes, and final gate decisions.
Choose a Solana RPC Server
Match CPU, RAM, NVMe, network, and location requirements to a Melbicom configuration, then run your acceptance fixture.