
Blog

Evaluating Mobile App Hosting Server Costs: Budget for Growth
Mobile apps have gone from side projects to top-10 downloads overnight on the news cycle. The cost of infrastructure typically increases when adoption rises. A structured cost-projection model enables the founder to manage the growth rather than be a bill chaser. The discussion below outlines the four forces that drive the hosting bill, compares the three prevailing backend architectures currently available, and explains how FinOps practice and more advanced sustainability metrics turn raw infrastructure into competitive advantage.
Choose Melbicom— 1,100+ server configs — 21 Tier IV & III data centers — 39 CDN PoPs in 35 countries |
 |
How Much Does a Mobile App Hosting Server Cost and What Drives It?
A mobile app hosting server budget is driven less by total installs than by peak concurrent users, media volume, push fan-out, and regional latency requirements. Small apps can stay mostly cloud-based; once traffic becomes predictable, dedicated servers and CDN offload can improve unit economics by turning variable egress and compute into planned capacity.
| Driver | Why It Matters | Typical Cost Trigger |
|---|---|---|
| User concurrency | Determines CPU, memory, DB connections | Instance count, cluster size |
| Media weight | Images & video dominate traffic mix | Bandwidth and storage fees |
| Push traffic | Notifications create bursty loads | Elastic instances, queue capacity |
| Regional latency | Global users expect low RTT | Extra PoPs, data-sync overhead |
User concurrency
Your baseline fleet is determined by the peak concurrent sessions, not the monthly active users. Each node has a limit on the number of requests per second; when that is exceeded, a different server (or VM) is brought online. Repatriating a database-intensive load, 37signals saved nearly $2 million a year (Data Centre Dynamics), proving once again how fixed capacity flattens unit cost when concurrency goes above a few tens of thousands.
Media weight
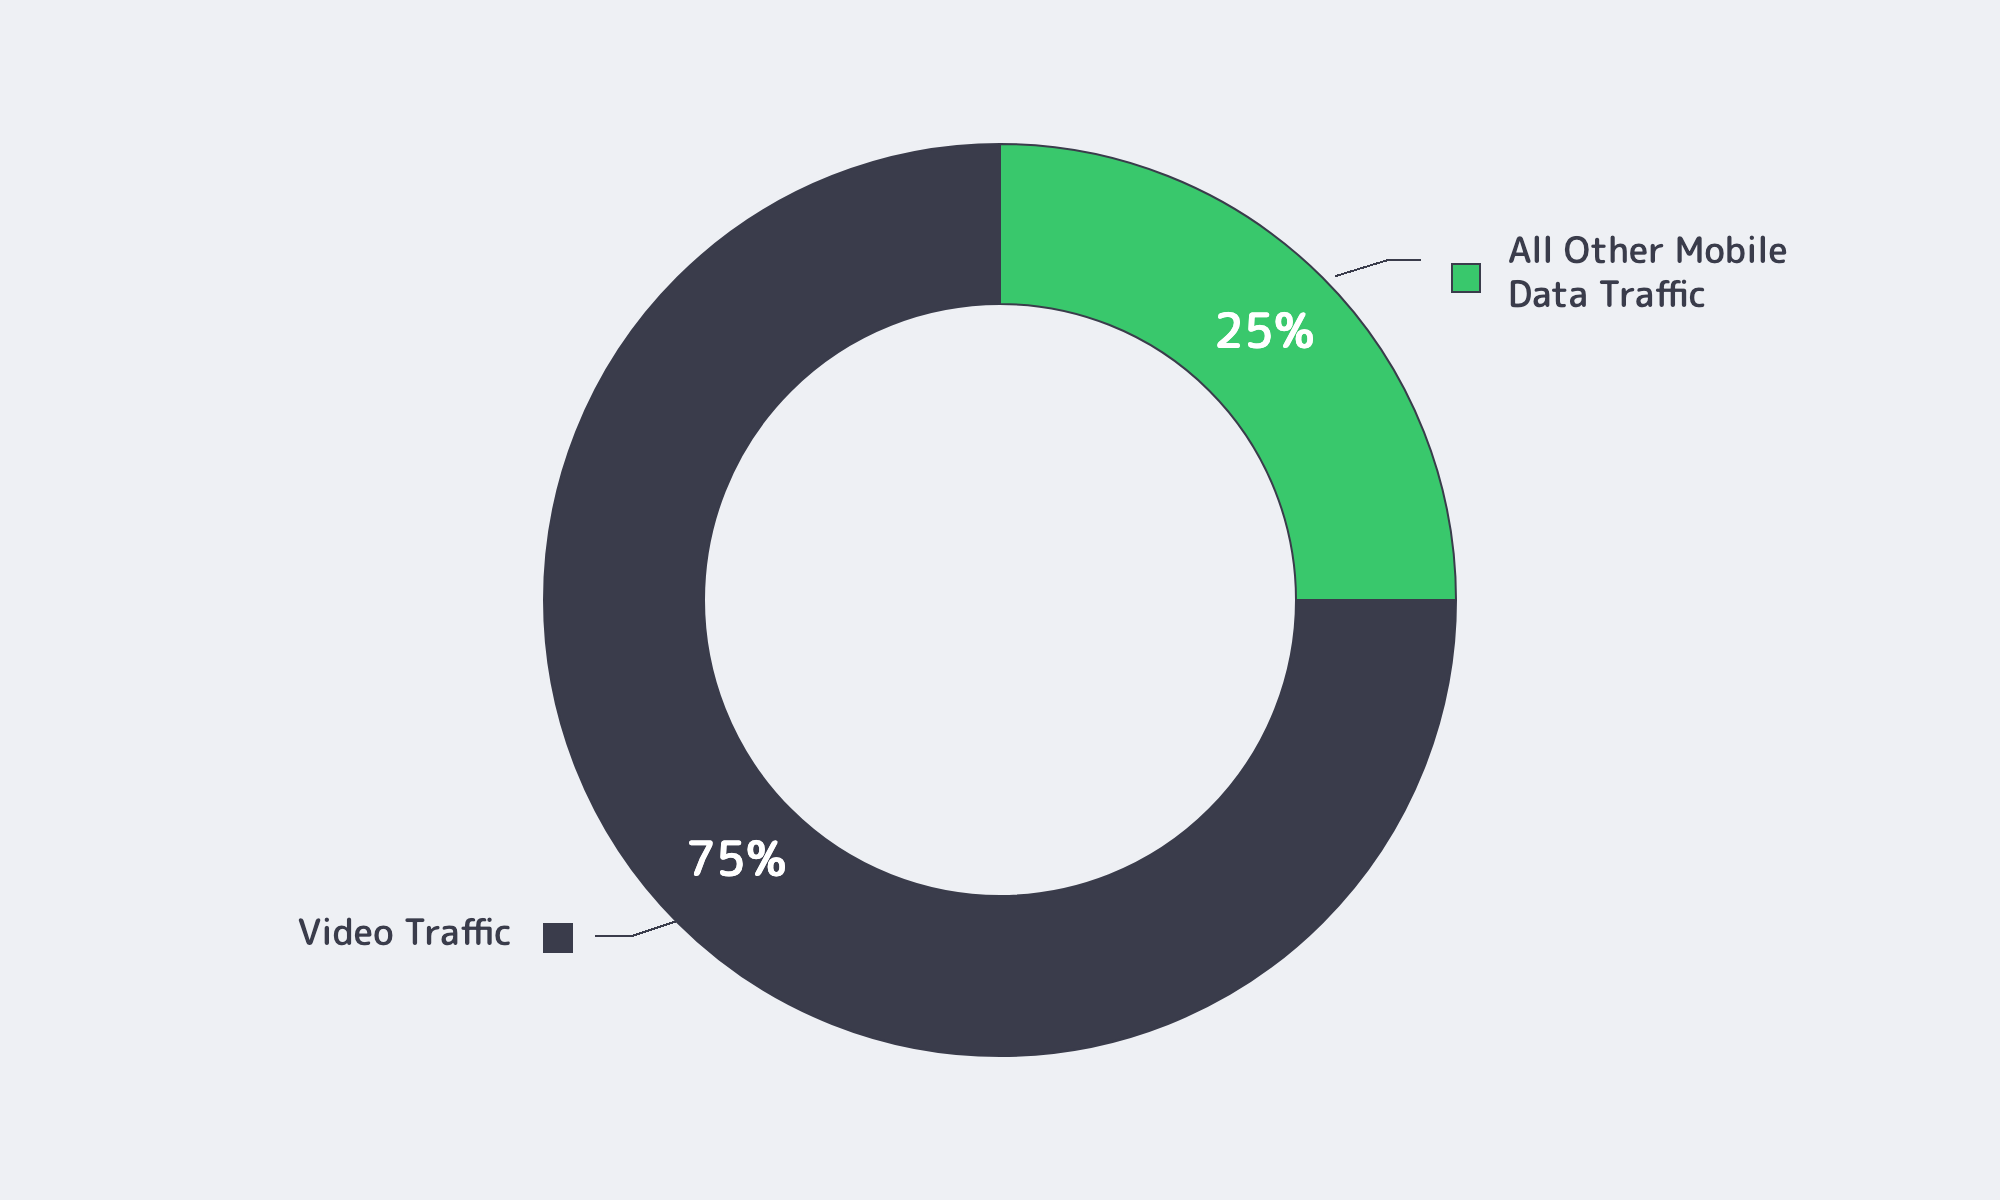
Video remains the largest mobile data driver, accounting for around 75% of all mobile data traffic at the end of 2025 (Ericsson Mobility Report). At cloud-list rates of $0.08–$0.12 per GB egress, 50 TB/month streaming translates to a $4,000–$6,000 line item. Dedicated servers can use unmetered ports; combining them with a CDN that offloads repeat hits can protect origin bandwidth and make egress costs easier to forecast before traffic spikes.
Push traffic
The average app user receives 46 push notifications per day (MobiLoud). A single fan-out of one million devices can increase backend load 10x within a minute. Cloud auto-scaling increases resiliency against downtime but is billed per second at the peak capacity. Hardware does not suffer surprise invoices, but either requires headroom provisioning or throttling queues.
Regional latency
Rule of thumb: each 100 km of fiber adds about 1 ms round-trip. For highly interactive app flows, sub-100 ms RTT is a practical planning target; an often-cited Amazon benchmark found that every 100 ms of latency could cost 1% in sales (GigaSpaces). Satisfying the threshold implies placing compute close to audiences or putting a CDN in front. Melbicom delivers 21 Tier IV and Tier III data centers, including Tier IV capacity in Amsterdam, plus 39 CDN PoPs across 35 countries, without the need to stitch together a patchwork of vendors.
Sample Cost Projection: 10 K vs 1 M MAUs
| Monthly Users | Hosting Model | Baseline Servers | Peak Cloud Nodes | Monthly Cost* |
|---|---|---|---|---|
| 10 K | Pure cloud | — | 8 | ≈ $2.9 k |
| 10 K | 1 dedicated + cloud burst | 1 | 2 | ≈ $2.0 k |
| 1 M | Pure cloud | — | 120 | ≈ $124 k |
| 1 M | 14 dedicated + CDN + burst | 14 | 20 | ≈ $66 k |
Assumptions: 150 requests per user / day; 500 MB media/user / month; 40 % CDN hit ratio; cloud egress $0.09/GB; dedicated bandwidth unmetered. Committed pricing: 1 mid-range server at $1.4 k/mo; 14 premium 32-core/200 Gbps servers at $4 k/mo each. Pure-cloud totals include managed DB, storage I/O, and monitoring charges.
Two lessons stand out
- Unit economics curve early. In this model, cloud is already more expensive than a single dedicated server at 10 k MAUs, and the difference widens rapidly beyond roughly 25 k MAUs.
- Media-intensive budgets are dominated by bandwidth. Offloading 40 percent of traffic to a CDN and pushing the rest through high-throughput dedicated ports can reduce total spend by approximately half when traffic gets heavy.
Choosing Among Today’s Hosting Options
Dedicated servers
Monthly physical machines work best when workloads are steady and predictable.
- Cost efficiency at scale. No premium per virtualization; the price per core decreases with the utilization.
- Consistent performance. Single tenancy prevents noisy-neighbor effects. Amsterdam ports scale up to 200 Gbps for heavy video traffic.
- Predictable budgeting. A single invoice; no surprise scale-outs.
Trade-offs: Capacity expands in step-function increments and requires lead time (Melbicom maintains 1,100+ ready-to-go configurations). Operating systems still need to be patched by Ops teams, and clustering has to be managed.
Autoscaling cloud fleets
The most popular launch pad remains the public cloud.
- Instant elasticity. Instances are ready in minutes, removed when idle; ideal to deal with viral spikes or A/B tests.
- Managed ecosystem. Databases, queues, observability through API.
- Granular billing. Pay by the second—until traffic slows down.
Drawbacks: Flexera’s 2026 State of the Cloud report estimates wasted cloud spend at 29%, while 63% of organizations now rely on FinOps teams to advise on, manage, or execute cloud cost optimization strategies (Flexera). Once a baseline is reached, dedicated hardware becomes less costly; a FinOps discipline is required.
Edge CDNs
Edge networks work around latency and reduce egress bills.
- Asset offload. Static media delivered close to users at predictable per-GB rates.
- Edge compute. Light scripts run near users for auth and personalization.
- Global reach, minimal footprint. Being able to have only one origin plus CDN can be cheaper on a per-user basis than multi-region backends.
Restrictions: stateful services still use central data stores, and per-request metering can become expensive as API calls move outward.
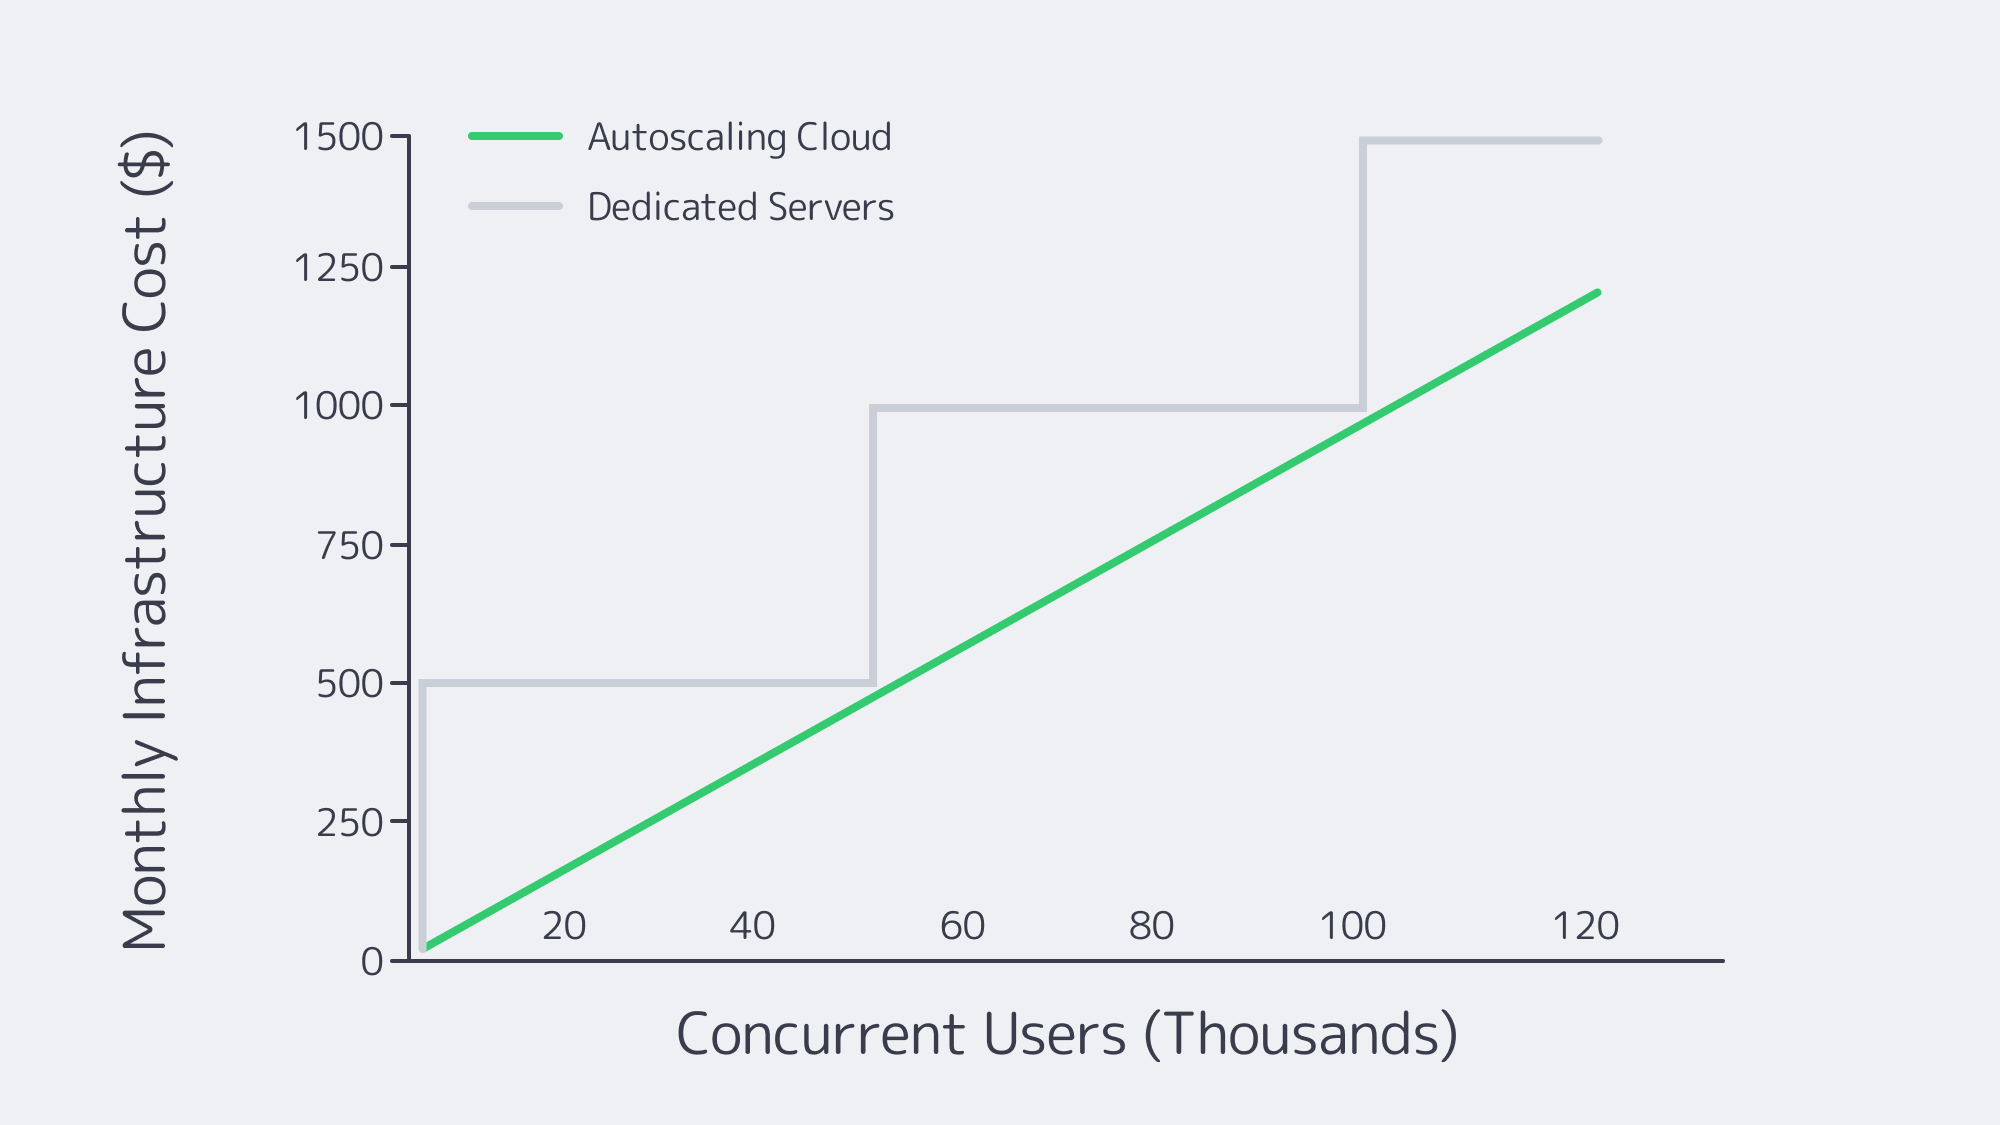
Cloud costs rise in lock-step with traffic; dedicated hosting spend climbs only when another server is added. Apps with high baselines hit break-even quickly.
Hybrid playbook in practice
Most rollouts begin all-cloud. At ~50 k DAU, the bill triggers a migration: the primary database and transcoder move to two dedicated boxes in Melbicom’s Amsterdam facility. Elastic cloud front ends continue to scale. A CDN layer serves/caches ~80 % of origin hits. Latency goes down, costs remain stable, growth persists—the prototypical hybrid pivot that every scale-focused founder should plan.
FinOps and Sustainability Governance
FinOps treats infrastructure as inventory: monitor usage, manage waste, and relate spend to revenue.
- Cost visibility. Tag resources, surface spend by feature.
- Continuous rightsizing. Turn off idle VMs, scale back oversized DBs, migrate consistent load to dedicated lower cost hardware.
- Smart commitments. Maintain a mix of reserved cloud, spot VMs and dedicated leases to achieve the best combination of flexibility and discounts.
- Automated schedules. Dev/test clusters that sleep during the night save 20-30 % of monthly charges.
Flexera’s 2026 State of the Cloud report estimates that 29% of IaaS and PaaS cloud spend is wasted and that 63% of organizations now rely on FinOps teams (Flexera).
The new multiplier is sustainability. Uptime Institute’s 2025 survey puts the weighted average annual PUE at 1.54, while many new high-latitude facilities in North America and Europe report PUEs of 1.3 or better (Uptime Institute). Equinix reported 96% renewable energy coverage across its retail IBX data centers in 2025 (Equinix). Compression of idle cycles, region selection, and aggressive use of caching reduce carbon and cost, now reported together as two KPIs.
From cost center to competitive edge
The FinOps dashboards that demonstrate the cost per push or carbon per signup, along with the latency charts, contribute to better code. Optimizing a single hot query can cut database spend by double-digit percentages; multiplied across microservices, those savings can fund entire feature sprints.
Sustainability planning is becoming more data-driven as well. For European workloads, the European Environment Agency now publishes country-level greenhouse gas intensity for electricity generation, and its 2025 update identified Sweden, Finland, and Luxembourg as the lowest-intensity EU producers in 2024 (European Environment Agency). Pairing those grid signals with latency, utilization, and infrastructure choices turns cost and carbon optimization into a sales opportunity rather than a compliance burden.
How to Future-Proof Your Mobile App Backend with a Hosting Server

The three attributes, cost, performance, and sustainability, are no longer in conflict. Plan your concurrency, media, push, and latency plots; forecast when cloud premiums sink their teeth; pre-provision bandwidth where video reigns; and deploy edge caches where RTT is critical. Hybrid architectures—dedicated servers in the steady core, cloud bursts at the peaks, CDN PoPs at the edges—provide applications with the runway to go viral without head-spinning invoices, provided FinOps keeps the spotlight on unit economics.
Spin Up a Dedicated Server Today
Deploy premium hardware with up to 200 Gbps ports and global CDN support, then keep hosting costs predictable as traffic grows.