
Blog

Dedicated Server Hosting Amsterdam: How to Choose an EU Connectivity Hub
Choosing an Amsterdam deployment should be less about putting “Netherlands” or “EU” on a quote and more about whether the metro behaves like a real connectivity hub under production traffic.
AMS-IX’s February 2026 facts-and-figures update says Amsterdam handled 35.66 exabytes of traffic in 2025, reached 902 connected parties, and grew active port capacity to 69.57 Tb/s. In April 2026, AMS-IX reported a new Amsterdam peak above 15 Tb/s.
That density is the reason Amsterdam works as an EU anchor: peering, transit, and European traffic already converge there. Cushman & Wakefield’s April 2026 EMEA update put Amsterdam at 852 MW of operational data-center capacity; Europe’s largest core markets still represent more than 45% of regional operational capacity.
Choose Melbicom– 1,400+ ready-to-go servers – 21 global Tier IV and III data centers – 24/7 infrastructure support |
 |
Why Dedicated Server Hosting in Amsterdam Works for EU Workloads
Dedicated server hosting in Amsterdam works for EU workloads when one node keeps most Western and Central European users inside roughly 10–25 ms RTT, connects through dense local peering, and supports clean 1–10+ Gbps delivery. The tradeoff is reach: Spain, Italy, and farther-eastern markets may still need a second region for low interactive latency.
Amsterdam’s advantage is path quality. DE-CIX’s FAQ explains that Internet Exchange access can reduce latency by shortening traffic paths and improve resilience by creating more redundant routes. That is the buying logic: a better chance of direct routes into the networks that matter.
Cushman & Wakefield says Amsterdam remains one of Europe’s largest hubs, but growth is shaped by power and permitting constraints. That makes operational evidence more important than expansion narratives: available inventory, test IPs, realistic port speeds, and a provider network that can support traffic after launch.
For Melbicom, the Amsterdam decision framework is intentionally location-specific. Our Amsterdam dedicated server capacity includes 250+ ready-to-go configurations across Tier III and Tier IV data-center environments, Intel and AMD CPU options, and 1–200 Gbps per-server network connectivity. That matters when Amsterdam is not just a server location, but the first node in a wider European delivery design spanning Melbicom’s network backbone, European dedicated servers, and CDN.
Amsterdam Latency, Interconnection, and Bandwidth Requirements to Compare
Dedicated server hosting in Amsterdam should be compared on measured RTT to target metros, peering and transit quality, and whether bandwidth pricing matches sustained throughput rather than burst headlines. A practical cut line is simple: if top markets sit below about 25 ms RTT and 95th-percentile traffic fits the commit, Amsterdam is doing real work instead of only looking central on a map.
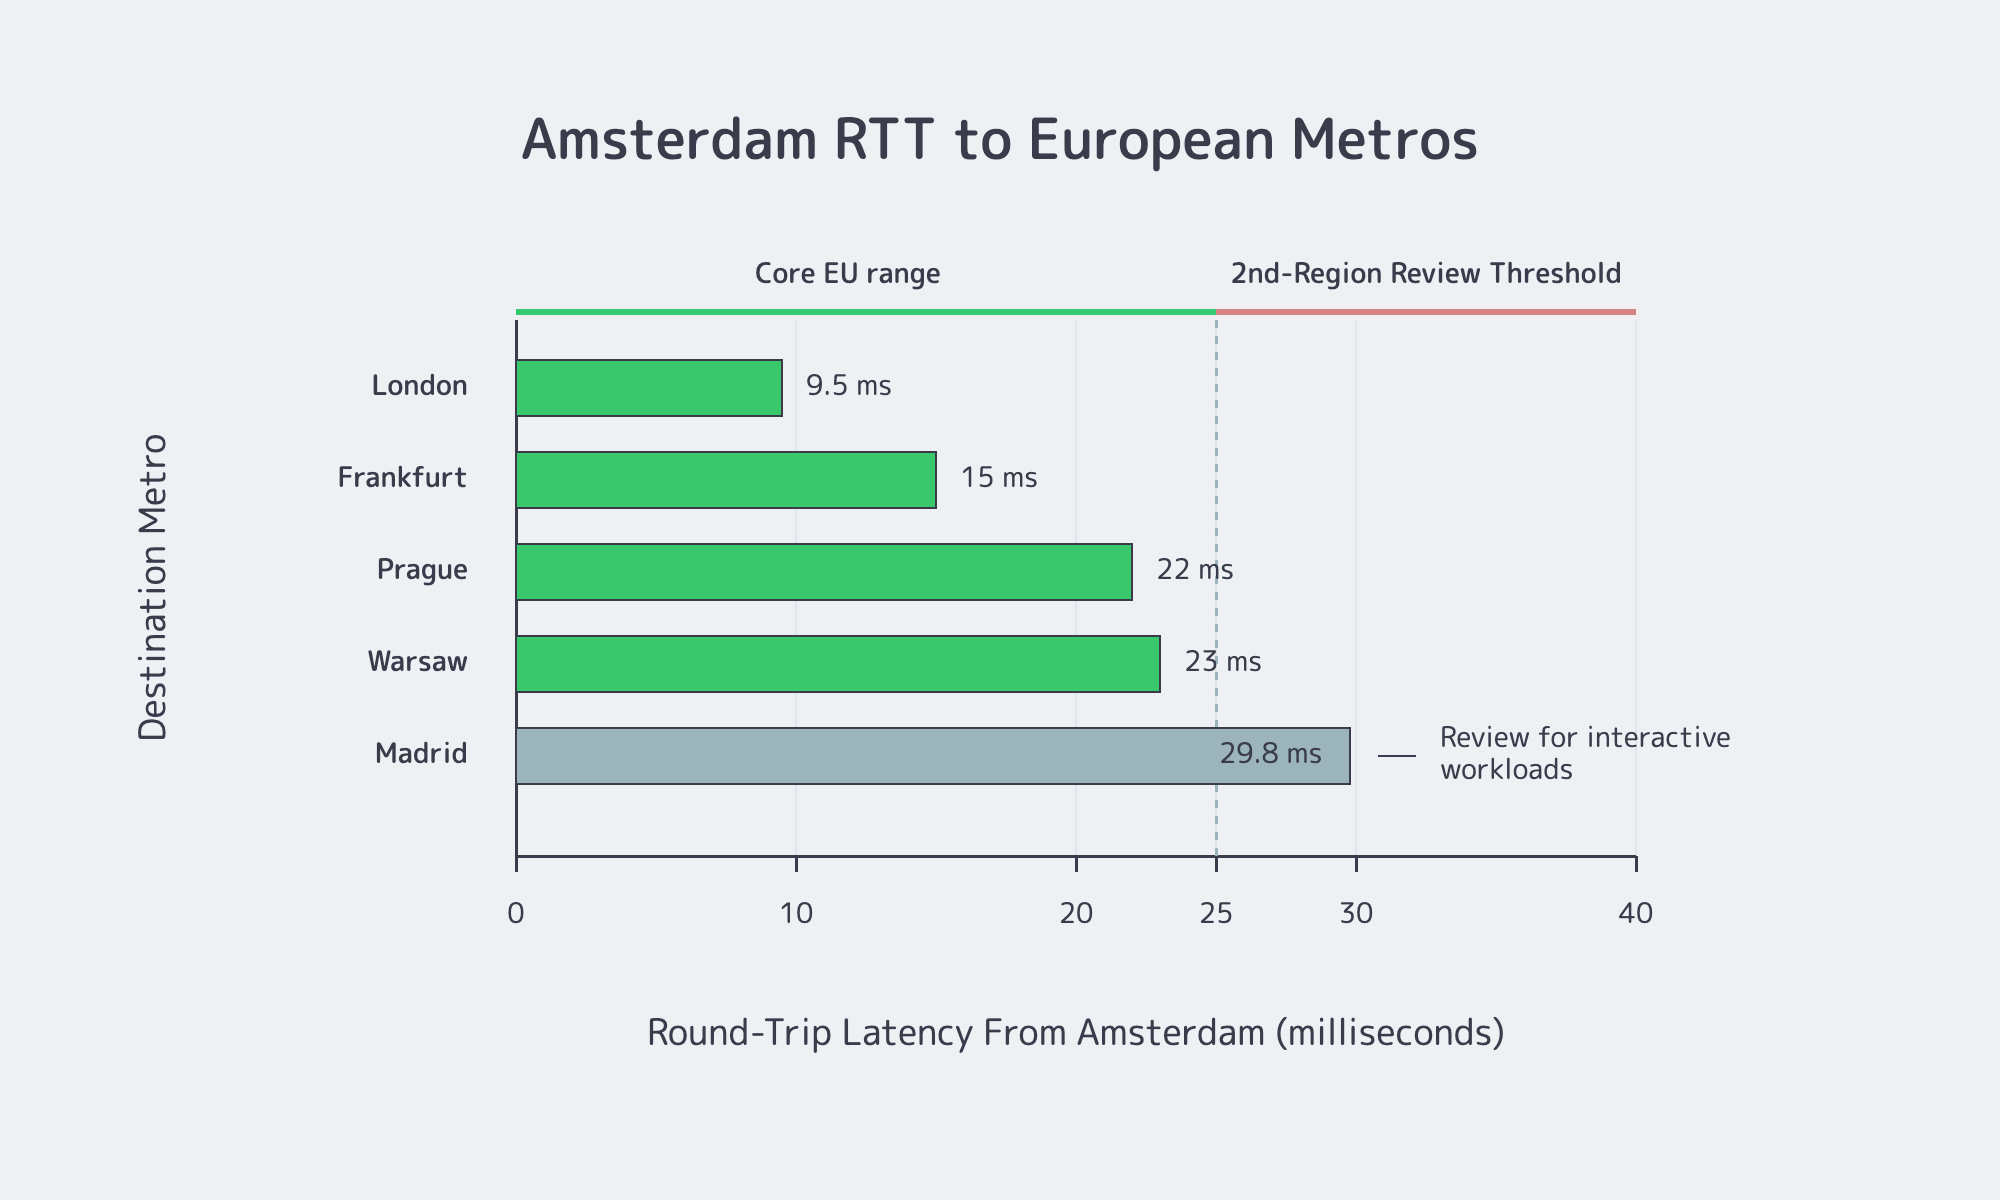
Start with latency. WonderNetwork’s Global Ping Statistics are generated by 30 pings per city pair and displayed as averages; they are not end-user guarantees, but they are useful directional planning data for an Amsterdam origin, API node, or control-plane service. The metros below are also markets where Melbicom has dedicated server capacity, CDN PoP capacity, or both.
| Destination From Amsterdam | Indicative RTT | Operational Takeaway |
|---|---|---|
| London | ~9.5 ms | Strong fit for interactive traffic |
| Frankfurt | ~14–16 ms | Very solid core-market coverage |
| Prague | ~21–23 ms | Strong Central Europe coverage |
| Warsaw | ~23 ms | Acceptable for many workloads; monitor p95 |
| Madrid | ~29.8 ms | Often where a second region starts to make sense |
The pattern matters more than any single sample. London and Frankfurt are excellent; Prague and Warsaw are still reasonable; Madrid is where Amsterdam starts acting like a strong regional core, not a universal edge. A Cloudflare Radar Europe quality view showed continental median RTT at 27 ms, with 18 ms at the 25th percentile and 42 ms at the 75th.
Interconnection is what decides whether those numbers hold under load. A poor route can overwhelm map distance; the fix is simple but often skipped. Ask for test IPs, run traceroutes from priority markets, compare IPv4 and IPv6, and watch whether traffic stays direct during busy windows.
Bandwidth deserves the same discipline. Cloudflare’s bandwidth documentation explains the standard 95th-percentile model: sample utilization every five minutes, discard the top 5%, and size around the highest remaining value. A 10 Gbps port is not automatically a 10 Gbps economic fit if the commit is wrong.
Media workflows expose the risk fastest. YouTube’s current upload guidance recommends about 8 Mbps for 1080p SDR and 35–45 Mbps for 4K SDR uploads. Ingest, cache fill, replication, and mirror traffic can consume real capacity before viewer delivery is counted. API-heavy SaaS may fit 1 Gbps; origins, mirrors, segment distribution, and heavier hosting nodes often start more honestly at 10 Gbps or above.
Amsterdam Resilience and DDoS Protection
Network density does not remove operating risk. Uptime Institute’s May 2025 outage analysis said IT and networking issues accounted for 23% of impactful outages in 2024, nearly 40% of organizations had suffered a major outage caused by human error over the previous three years, and 85% of those human-error incidents involved ignored or flawed procedures.
That makes redundancy a three-layer decision: facility, upstream path, and regional recovery. For low-stakes batch processing, one Amsterdam node may be enough. For customer-facing SaaS, media origins, and hosting platforms, Amsterdam plus route diversity plus a second European recovery point is safer than assuming a healthy server means a resilient service.
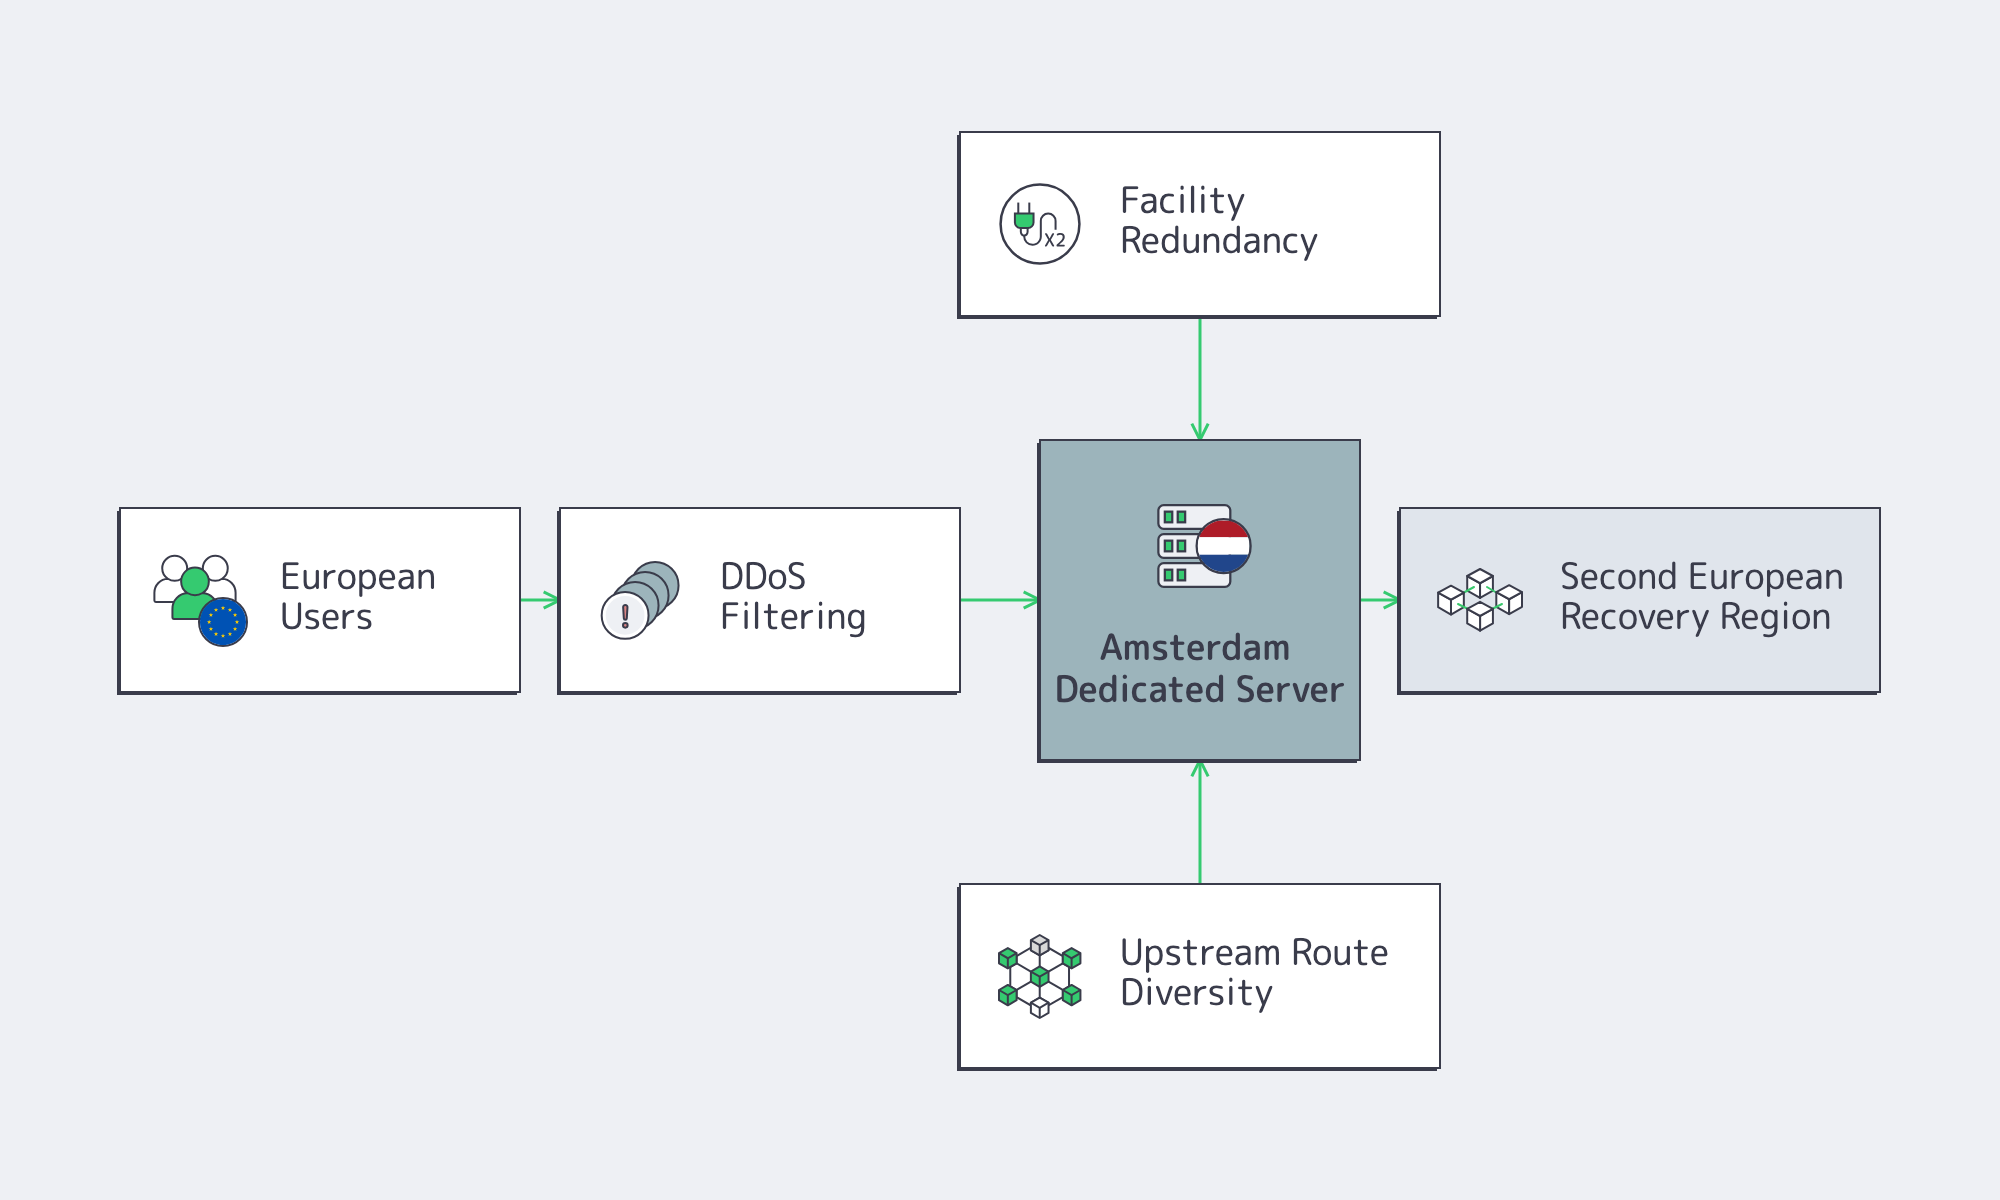
DDoS belongs in the baseline, not the appendix. Cloudflare’s Q1 2025 DDoS report recorded 20.5 million blocked DDoS attacks, up 358% year over year, including roughly 700 hyper-volumetric attacks above 1 Tbps or 1 Bpps. Its Q2 2025 report reported a 7.3 Tbps record attack and more than 6,500 hyper-volumetric attacks. For public Amsterdam nodes, ask where traffic is cleaned, how quickly legitimate traffic returns, how IPv6 is handled, and how user experience behaves during mitigation.
Workload Fit Decides the Amsterdam Choice
For SaaS platforms, Amsterdam is strongest as a control-plane, API, authentication, queue, or database-adjacent node when users cluster in Western and Central Europe. The latency pattern supports that profile, and the IXP density improves the odds of short paths. If a product is highly interactive and large cohorts sit in Southern Europe or farther east, Amsterdam should usually be the core node, not the only node.
For media teams, Amsterdam is especially useful for ingest, origin, packaging, storage-adjacent processing, and traffic-heavy control layers. Those jobs benefit from dense peering and higher port options, but they also punish under-bought bandwidth. Once replication, VOD movement, or cache fill becomes routine, the design usually looks better with larger ports and adjacent CDN logic. Melbicom’s CDN operates in 55+ locations across 39 countries, including Amsterdam, Frankfurt, London, Madrid, Paris, Prague, Palermo, and Warsaw, which makes the dedicated-server decision easier to connect to distribution strategy instead of treating origin and delivery as separate projects.
For hosting teams, Amsterdam fits mixed European demand where predictable route quality, peering, and high-throughput delivery matter more than physical proximity to one national audience. Shared hosting clusters, download nodes, mirrors, reverse proxies, and service platforms all fit that model. The actual test is whether Amsterdam matches the application’s latency budget, attack exposure, and sustained egress profile.
When Amsterdam Should Anchor Europe
Amsterdam should anchor a multi-region European deployment when Amsterdam keeps most users within the latency budget and can serve as the control-plane, origin, or ingest hub. Use Amsterdam first for Western and Central Europe, then add another region when large cohorts exceed roughly 25–30 ms RTT or failover must survive metro-level faults.
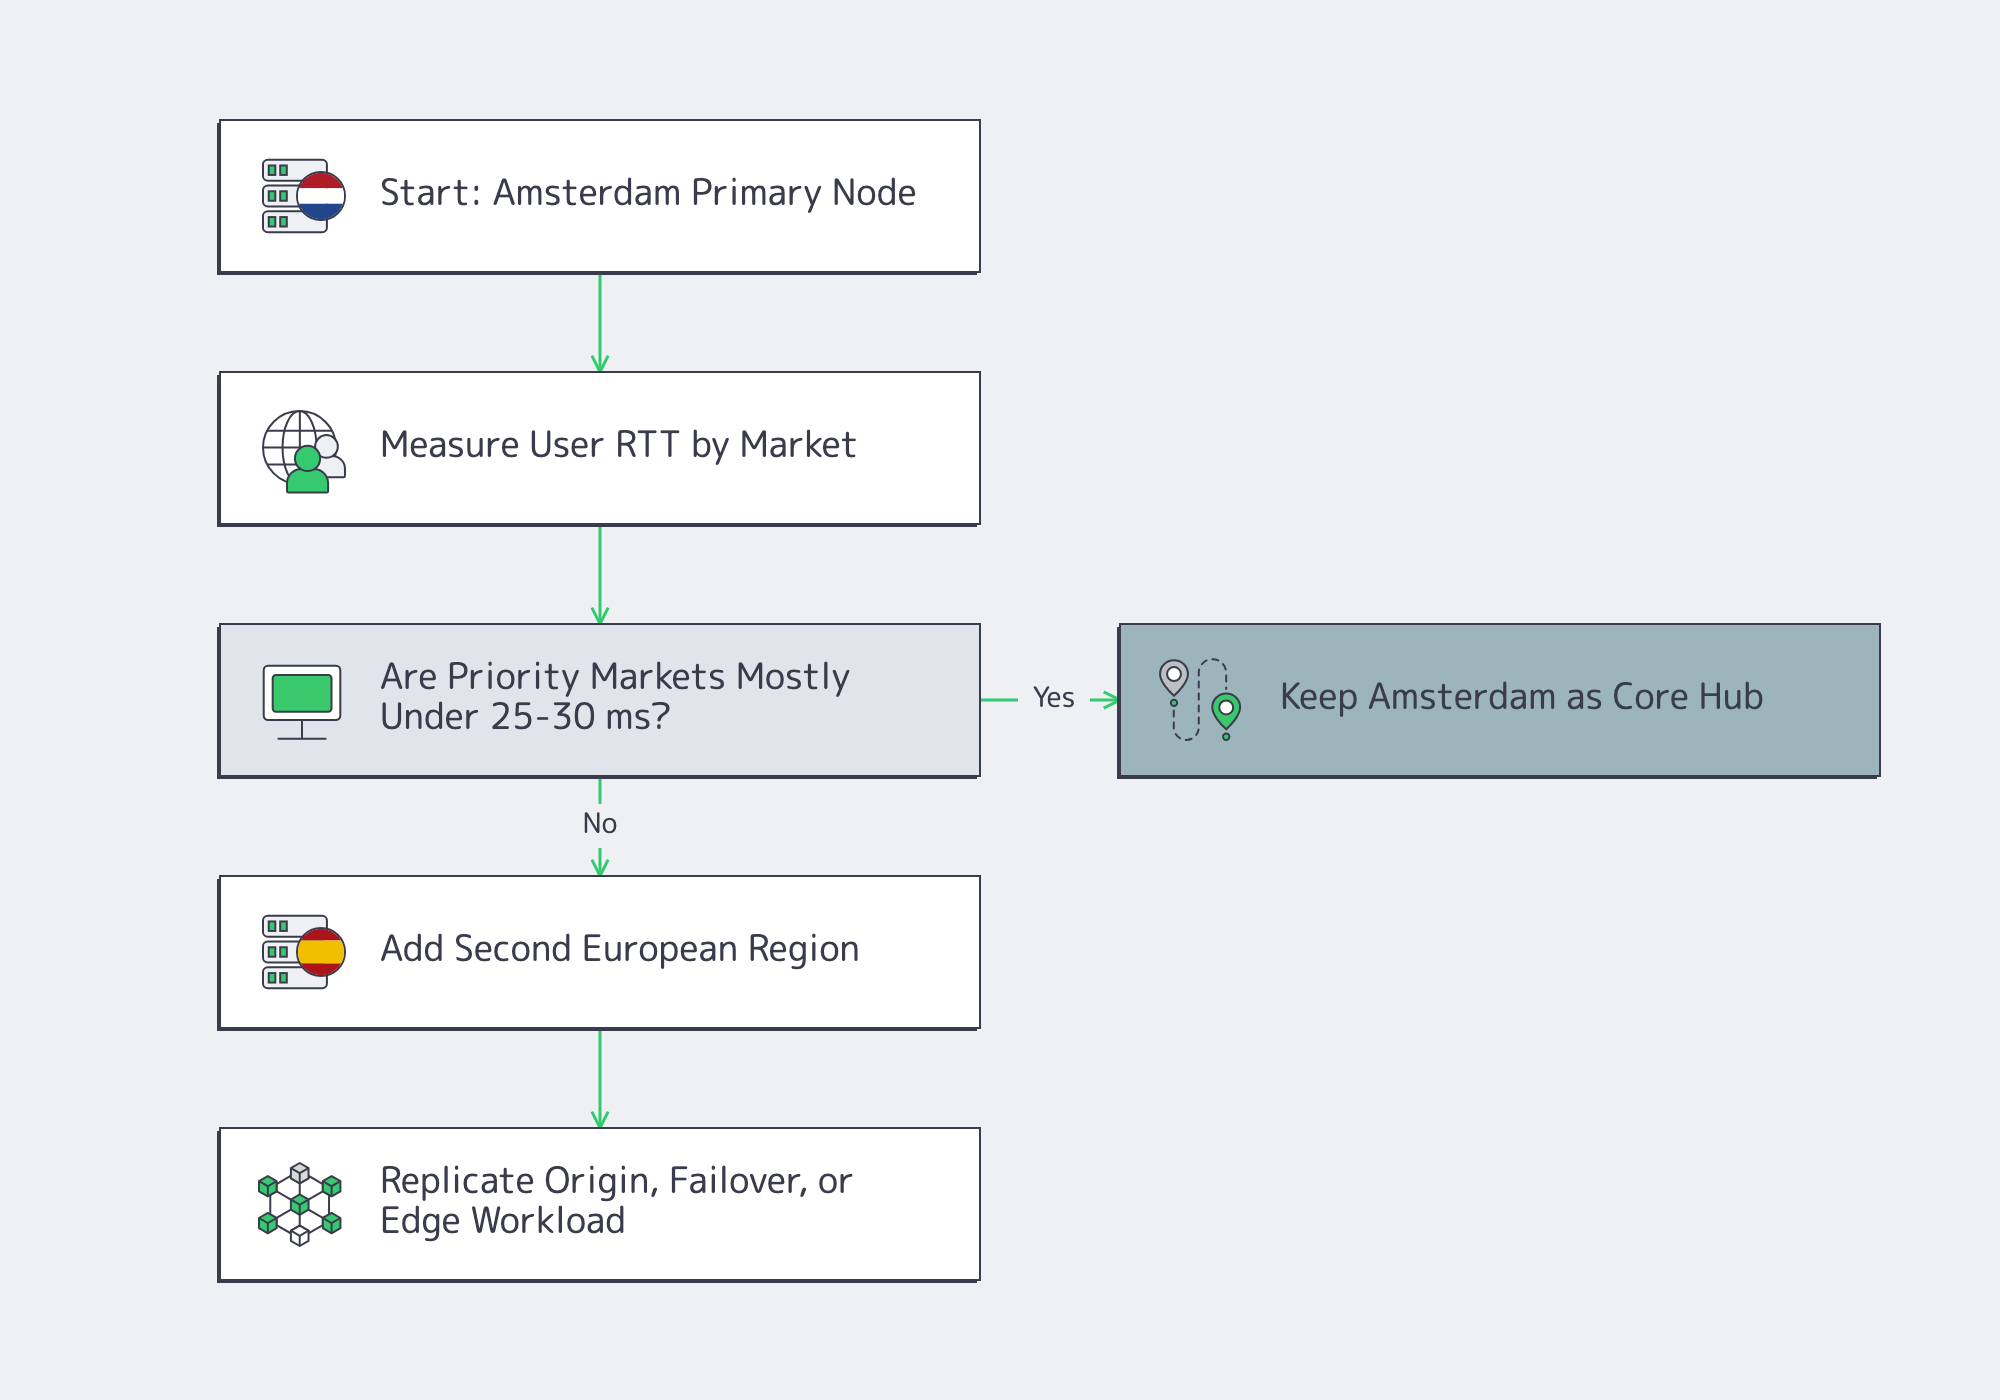
In practice, that means expanding from telemetry, not ideology. If Spain, Italy, or farther-edge cohorts miss the latency target, a second region stops being theoretical optimization and becomes product work. If outage tolerance is low, the second region is also non-negotiable because metro-level redundancy is not the same as European resilience.
This is where a broader footprint matters. Melbicom’s Amsterdam location can be combined with dedicated server locations such as Frankfurt, Madrid, Paris, Palermo, Warsaw, Riga, Vilnius, and Sofia, plus CDN PoPs in adjacent European markets. The cleanest pattern is usually Amsterdam first, then expand without rebuilding the network model.
The Practical Shortlist

The practical Amsterdam test is not “is this server in the Netherlands?” It is whether the Amsterdam node can hold the latency budget, route cleanly, absorb sustained traffic, survive failures, and fit the workload’s shape. Use five checks:
- Measure actual RTT from Amsterdam to real user markets; if large cohorts sit above roughly 25–30 ms, plan a second region early.
- Favor dense interconnection and route diversity over the cheapest nominal port.
- Buy bandwidth around sustained 95th-percentile traffic, not the biggest port headline.
- Treat redundancy as facility, upstream, and regional—not just server health.
- Assume DDoS pressure is part of the baseline design for public workloads.
For teams that want Amsterdam to behave like a practical EU hub instead of a symbolic location pin, the winning design is specific: measured latency, direct routing, correctly sized bandwidth, layered redundancy, and workload placement that respects geography. That is the natural point to evaluate Amsterdam capacity against real traffic plans rather than against a generic regional checkbox.
Explore Amsterdam Dedicated Servers
Melbicom’s Amsterdam dedicated servers give teams 250+ ready-to-go configurations, Tier III and Tier IV facility options, 1–200 Gbps per-server network connectivity, 1–100 Gbps bandwidth tiers with 50 TB or unmetered plans, and a path into Melbicom’s European infrastructure, network backbone, and CDN footprint. The value is highest when Amsterdam is treated as a measured EU anchor—not a shortcut around latency physics.
Deploy Dedicated Servers
Choose ready-to-go dedicated infrastructure and scale capacity without guessing.