Blog

Data Centers in California: Low-Latency Infra Without Capacity Risk
Choosing among data centers in California is a routing and capacity decision. Los Angeles is usually stronger for Southern California user traffic, Pacific-facing routes, and fast first-node deployment. Santa Clara is stronger for Bay Area adjacency and dense east-west interconnection. The risk is assuming low latency automatically means usable capacity.
The practical comparison is measured latency, energized power, interconnection reach, sustainability exposure, and deployment speed. The winning site proves the route, powers the rack, and ships capacity fast.
LA Servers– West Coast placement – Fast activation – Global Melbicom backbone |
 |
How Data Centers in California Compare for Latency and Capacity
Data centers in California should be compared by measured user-to-server latency first, then by deliverable capacity. Los Angeles often wins for Southern California and Pacific-facing workloads; Santa Clara wins for Bay Area adjacency. A site with attractive latency but no energized power, carrier diversity, or expansion path is a capacity risk, not a platform.
The California Energy Commission says California has more than 200 active data centers, using roughly 1,000 MW, about 2% of CAISO peak demand, in early 2026; by 2040, the forecast rises to 4,500 MW, or 9% of peak demand. CAISO separately says CEC forecasts data-center load on the ISO grid increasing by 1.8 GW by 2030 and 4.9 GW by 2040. Those numbers explain why “available California capacity” needs proof.
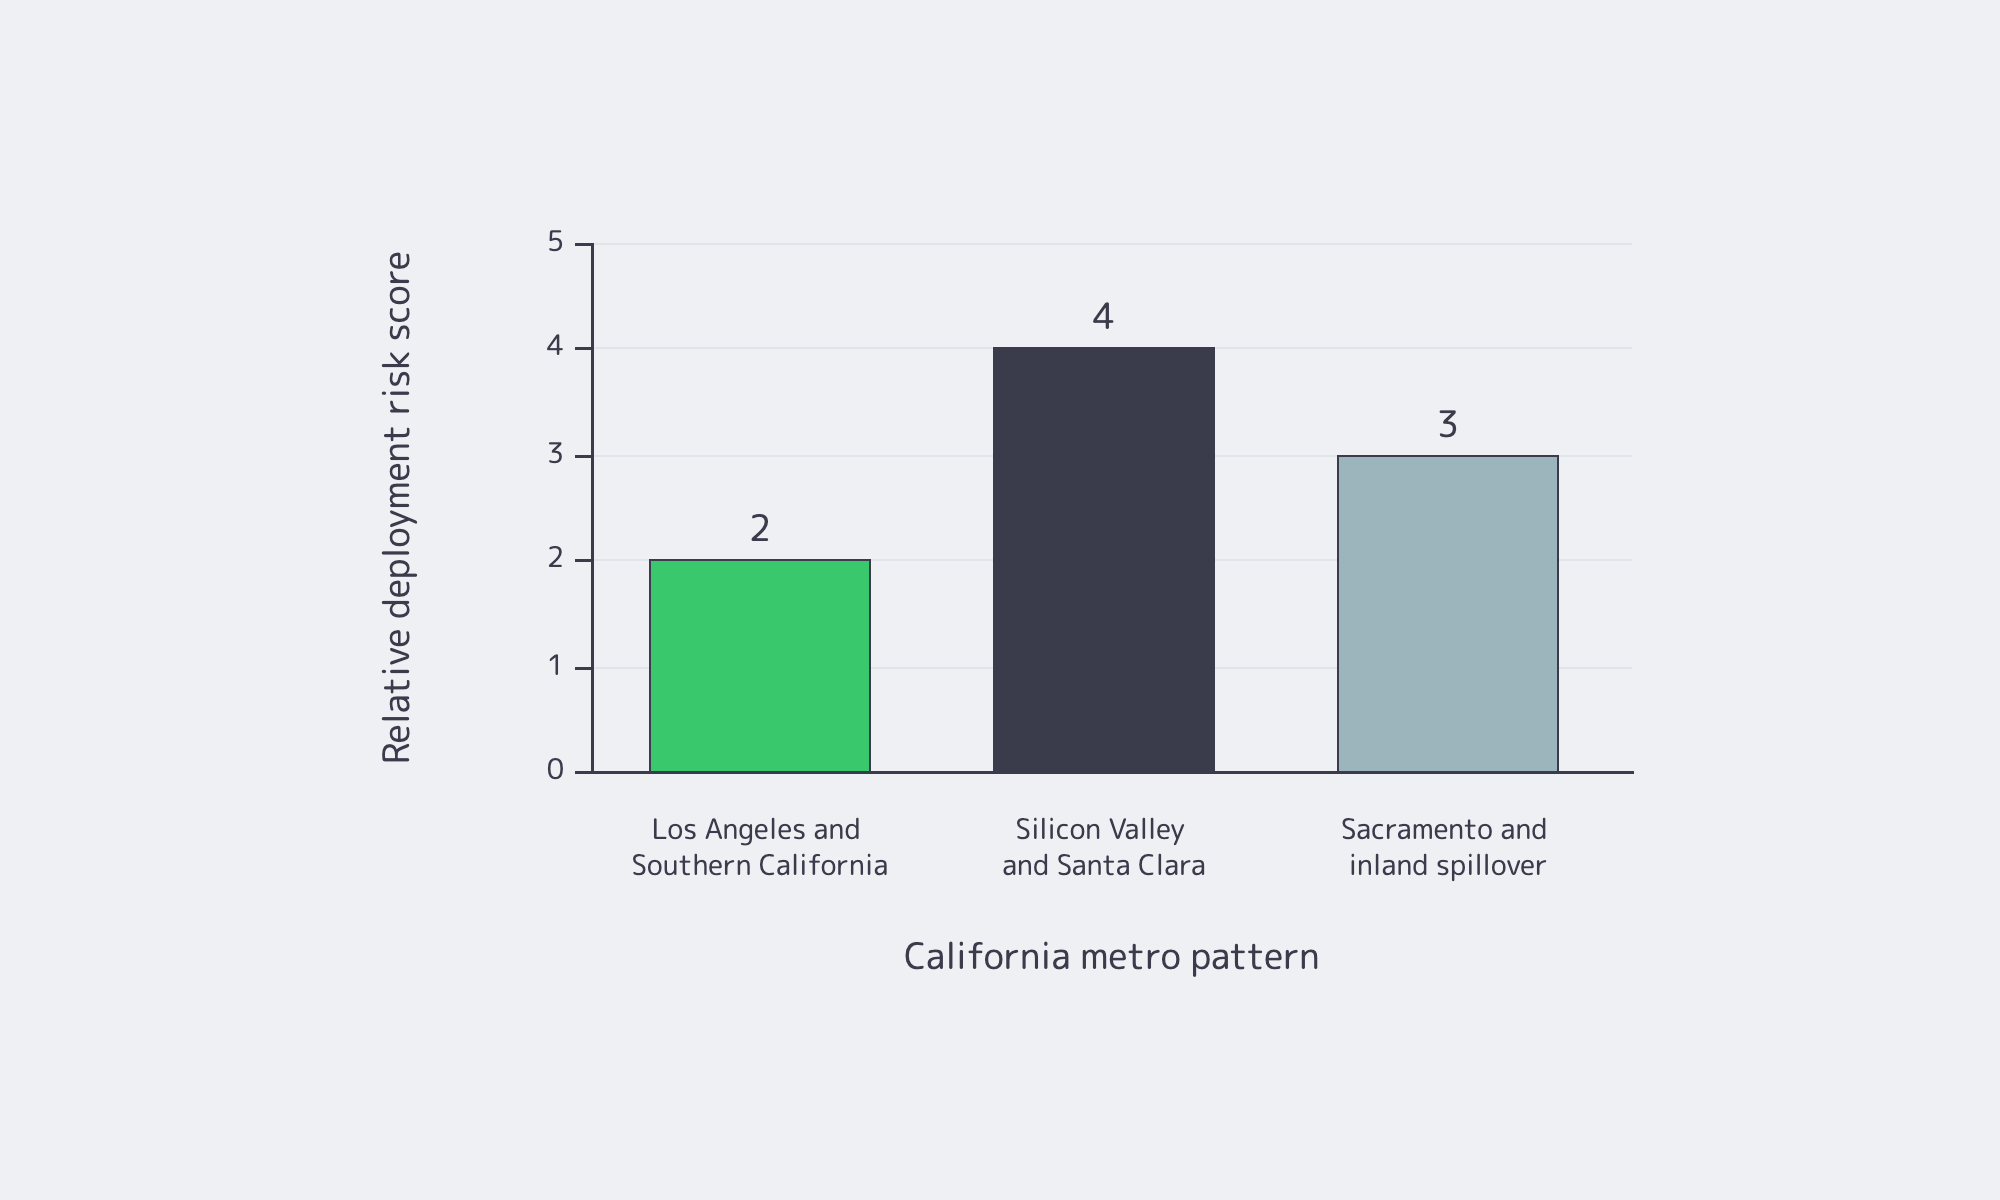
| California Metro Pattern | Best Fit | What to Validate First |
|---|---|---|
| Los Angeles and Southern California | Southern California users, Pacific-facing routes, fast first-node deployment | Energized power, carrier diversity, trace performance to major eyeball networks |
| Silicon Valley and Santa Clara | Bay Area users, cloud-adjacent traffic, interconnection-heavy tiers | Utility energization date, contiguous capacity, cross-connect plan, public PUE data |
| Sacramento and inland spillover | Overflow capacity and less latency-sensitive tiers | Added RTT, utility path, backhaul design, cooling and water model |
CBRE’s H1 2025 data-center reporting said Southern California had available retail and wholesale inventory. In Silicon Valley, power constraints limited new supply and pushed vacancy to a record-low 4.5%. Santa Clara city materials show more than 50 data centers; a 2025 city study session counted 56 active or under-construction standalone sites.
Latency still matters inside the state. Using standard light-in-fiber assumptions, the physical RTT floor is roughly 1.8 ms between Los Angeles and San Diego, about 4.8 ms between Los Angeles and San Jose, and about 6.6 ms between San Jose and San Diego before route stretch, switching, and congestion. For API-heavy, cache-sensitive, multiplayer, or real-time bidding systems, single-digit milliseconds are a budget. But routing can erase geography: a closer site that hairpins through poor transit can lose to a farther site with cleaner interconnection.
Interconnection Is What Separates Strong Data Centers in California
If latency is the headline, interconnection is the body text. TeleGeography’s 2025 State of the Network identified a downtown Los Angeles facility as the world’s most carrier-dense colocation site, and its submarine-cable research keeps California visible as a Pacific landing geography. PeeringDB exists for exactly this diligence: checking which networks, exchanges, and facilities are actually reachable.
The practical test is not “does this metro have carriers?” It is “which carriers, which exchanges, which cross-connect path, and what does the first packet to my top destination ASNs do?” Buyers should run traces and synthetic probes from the user networks that matter, then compare the results with facility-level interconnection data.
Dedicated Servers Versus Colocation for California Workload Deployment
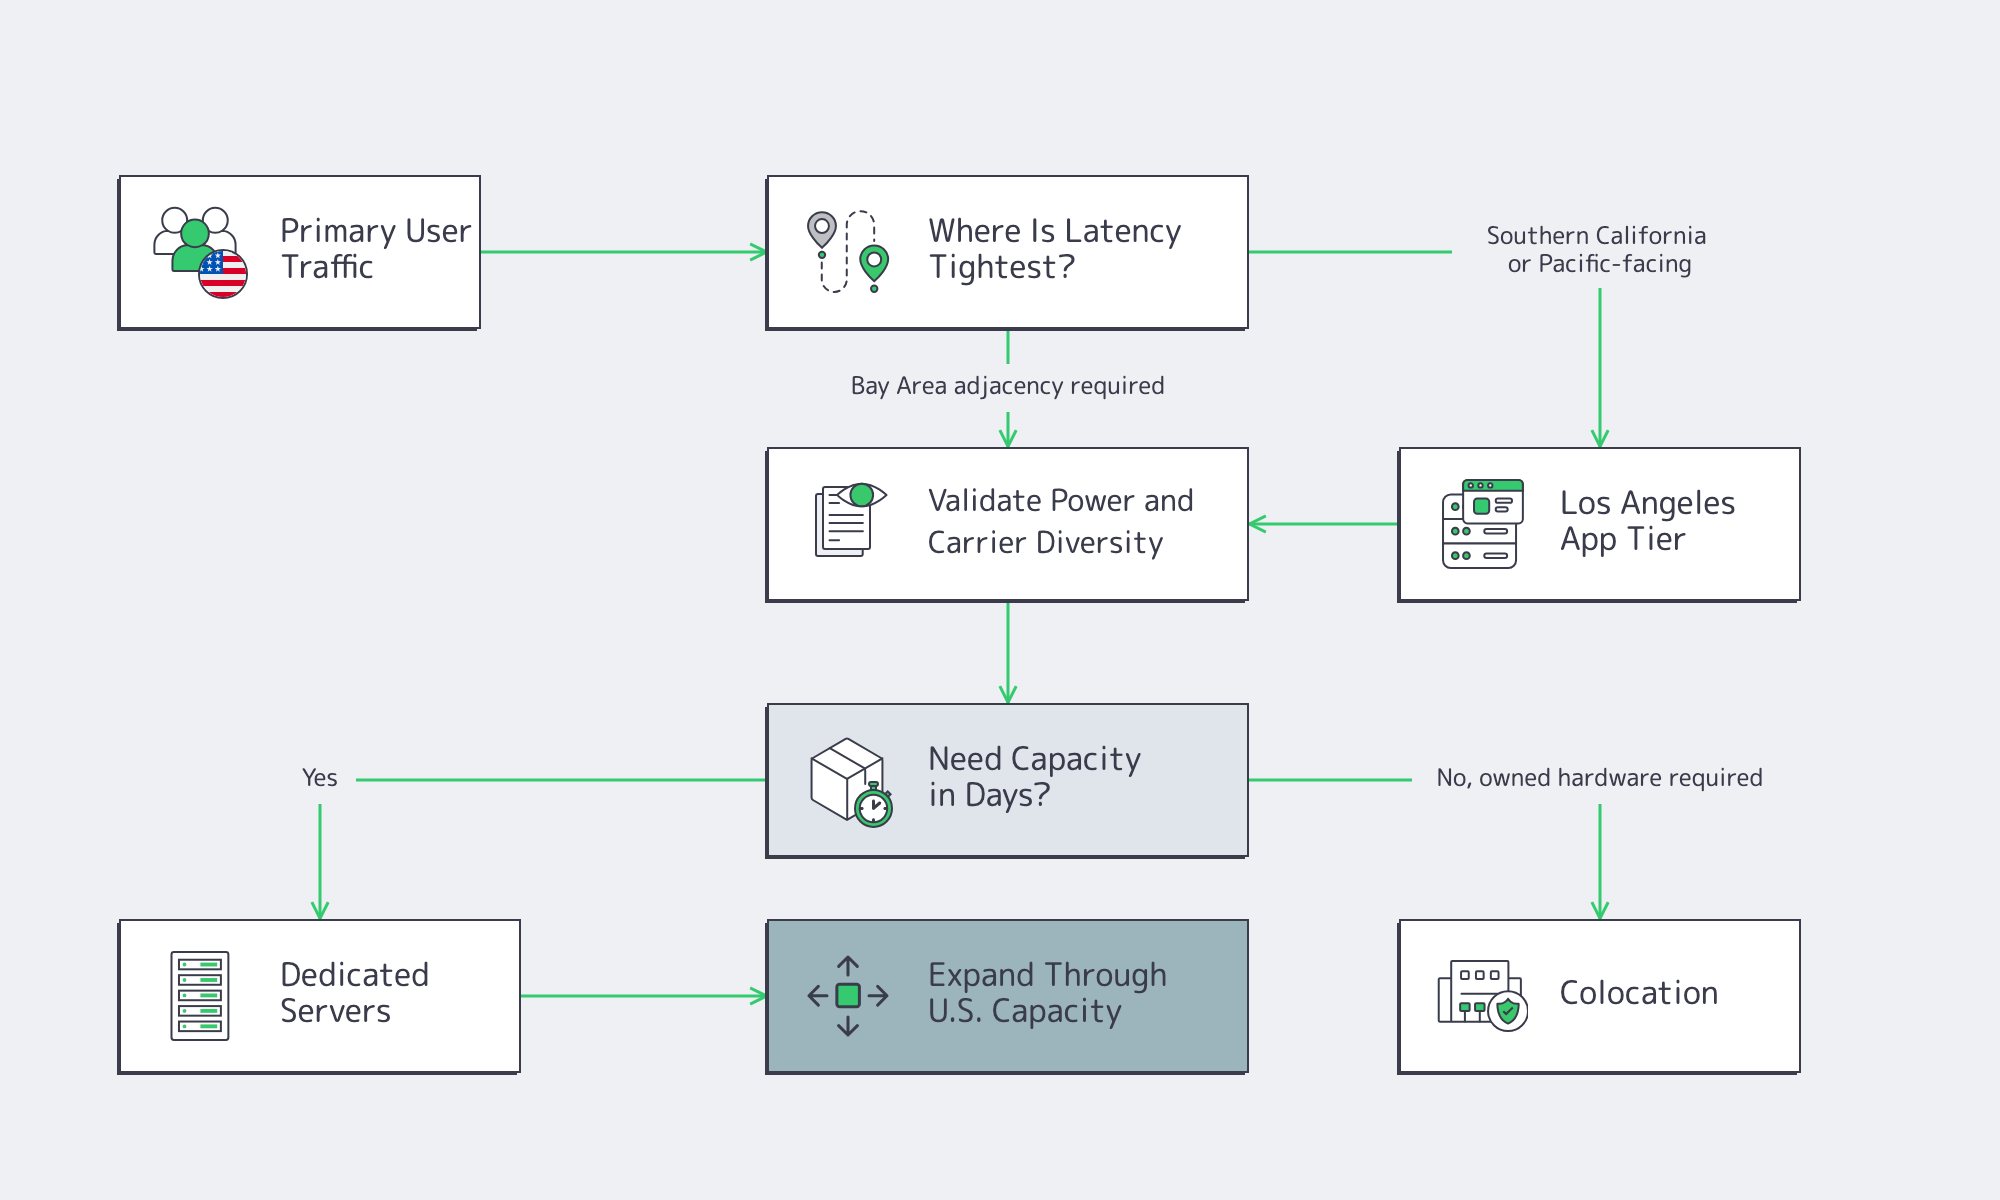
Dedicated servers usually beat colocation for California workload deployment when the constraint is usable capacity speed, not hardware ownership. If a new node must go live in days rather than weeks, pre-racked dedicated inventory is the lower-risk path. Choose colocation when specialized owned hardware or custom physical topology is required.
In colocation, the customer owns the servers and leases the facility environment. The data center solves space, power, cooling, and physical security, but the customer still has to procure, ship, stage, install, cable, and manage hardware before production traffic moves. Dedicated servers remove that front-end hardware lifecycle from the critical path because the infrastructure is already inside the provider environment.
That matters because capacity is tight. JLL’s year-end 2025 data-center analysis said North American vacancy stayed at a record-low 1% for a second consecutive year, with 92% of under-construction capacity already precommitted. Uptime Institute’s 2025 survey found operators dealing with power constraints, supply-chain delays, and density-driven planning problems. In that market, deployment speed is risk control.
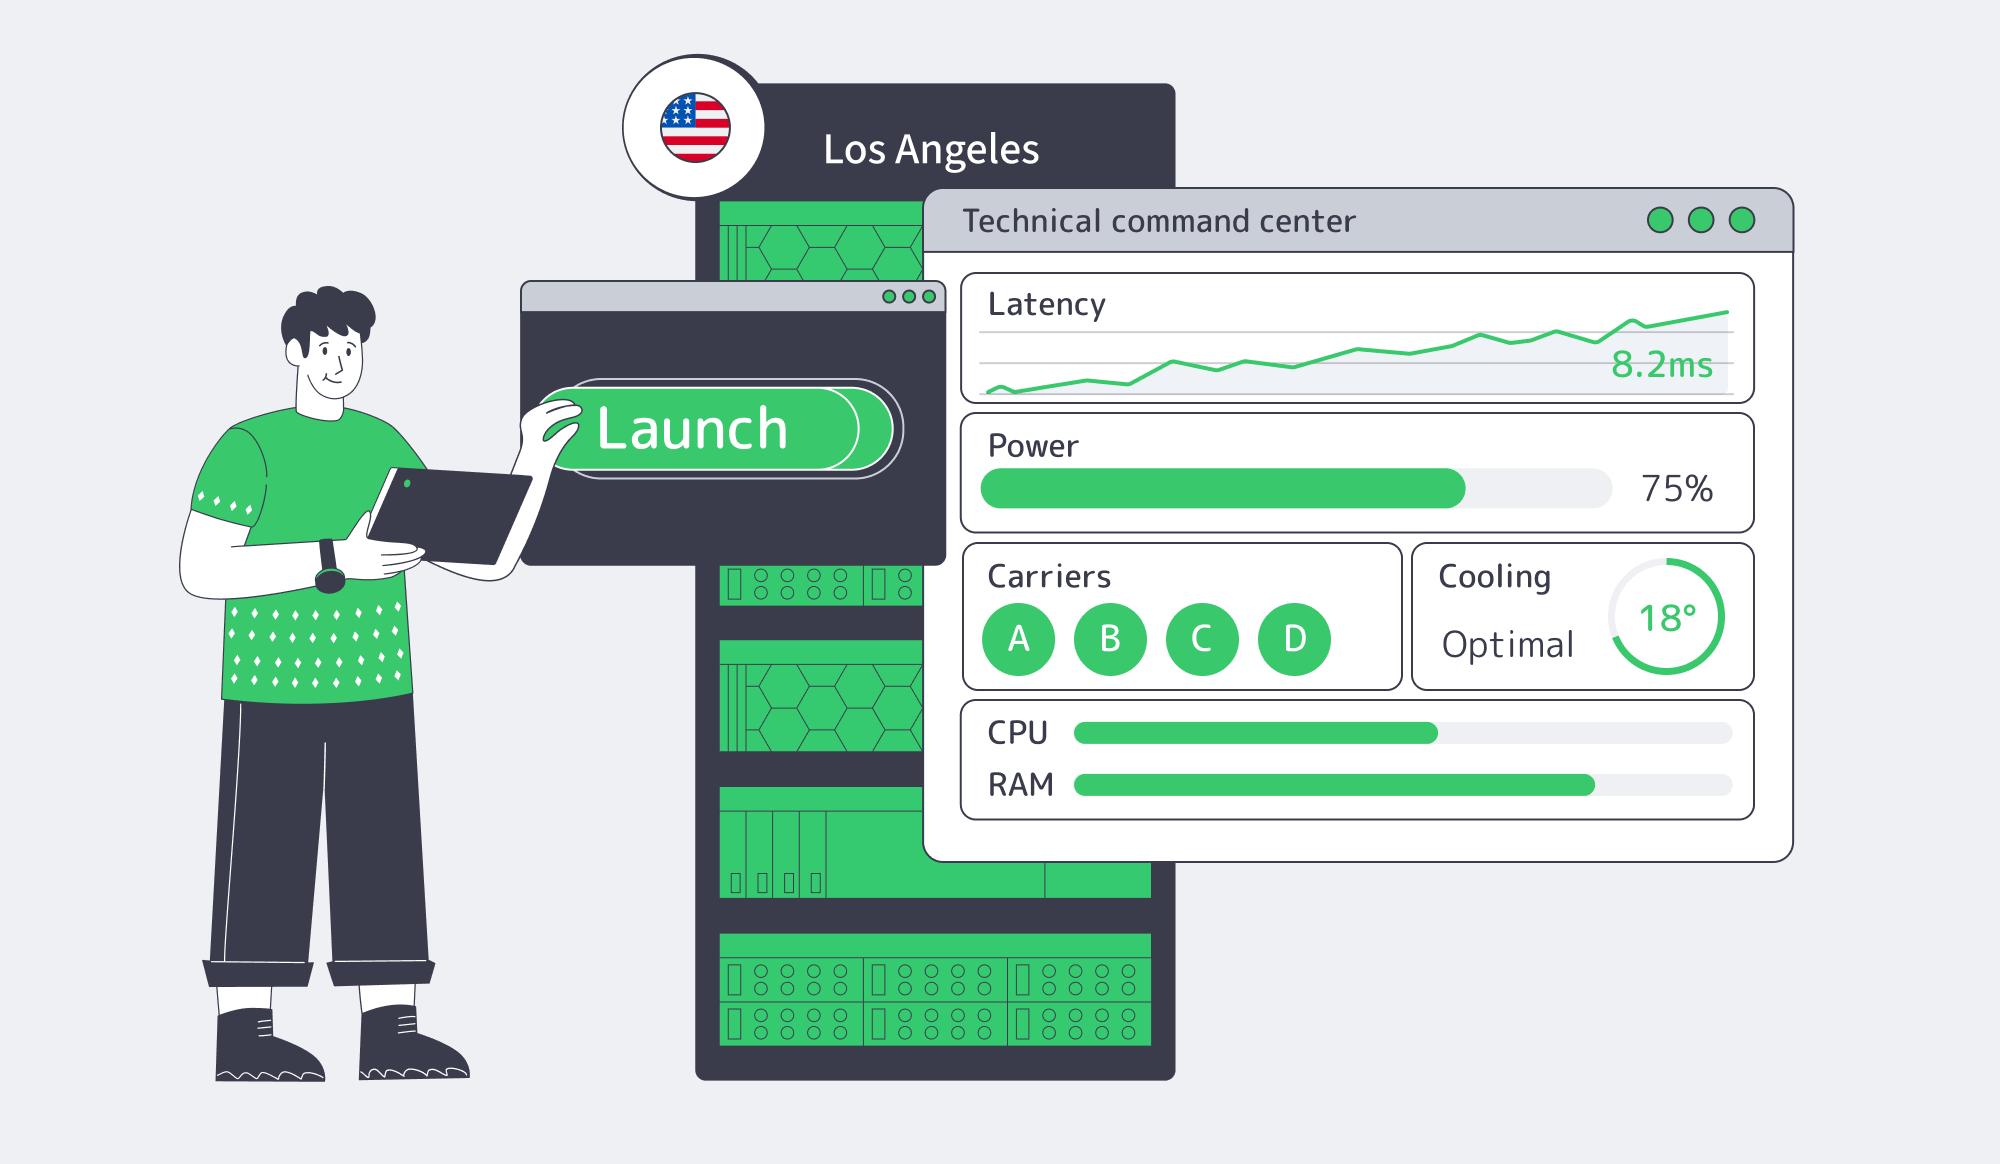
For California-facing capacity, dedicated servers in Los Angeles solve the first-node problem. Melbicom’s Los Angeles location includes 50+ server configurations in a Tier III data center. Across all dedicated server locations, Melbicom offers 1,400+ ready-to-go options, custom configurations in 3–5 business days, 20 other Tier III and Tier IV data centers, per-server connectivity up to 200 Gbps, 25+ IXP peering hubs, and 20+ transit partners worldwide.
Colocation still has a place. If a deployment depends on specialized appliances, long-lived owned assets, or a physical topology that a provider-led dedicated model cannot match, colocation is the cleaner fit. But when the blocker is “we need ten more West Coast nodes before the quarter ends,” dedicated servers are usually faster.
Power, Interconnection, and Sustainability Risks to Validate Before Deployment
Power, interconnection, and sustainability risks should be validated before any California deployment because one wrong assumption can neutralize every latency gain. Ask for three proofs up front: energized power delivery dates, exact carriers and exchanges reachable from the rack, and cooling and water data detailed enough to estimate carbon, cost, and local exposure.

Start with power. CAISO makes an important distinction: the ISO does not study retail load interconnections; those are governed by local utility tariff and process. A site with “planned megawatts” but no firm utility path is not deployable capacity. In May 2025, PG&E said it was seeing 8.7 GW of data-center-related electricity demand over the next decade, including 1.4 GW in final engineering and 4.1 GW of new requests through an additional cluster study.
Interconnection needs the same skepticism. PeeringDB and carrier lists are starting points, not proof. Buyers should validate the exact facility or campus, the cross-connect path, and measured latency to priority ASNs. A one-millisecond metro advantage disappears quickly if traffic exits through the wrong upstream.
Sustainability Exposure in Data Centers in California Is Local
Sustainability exposure in data centers in California is local, not generic. A 2026 Berkeley Law report said California still lacks a complete picture of data-center water use, current reporting is incomplete, and development speed warrants better disclosure. The report also framed the key tradeoff: water-saving cooling can consume more energy, while energy-efficient cooling can use more water.
That makes cooling method, water source, and reporting posture operational issues. Santa Clara recycled-water rules require recycled water for non-potable uses where available, suitable, and economically feasible, including industrial cooling systems with operational-plan requirements. The CEC benchmarking program requires annual energy-use disclosure for standalone data centers over 50,000 square feet and data centers inside buildings larger than 50,000 square feet. And the U.S. Department of Energy says data-center cooling can account for up to 40% of total data-center energy use, making cooling architecture a cost and sustainability variable.
Low-Risk California Deployment Pattern
A low-risk California deployment pattern puts latency-sensitive entry points closest to users and routes, then places less latency-sensitive scale where capacity is less fragile. Southern California can serve first-hop application tiers; broader U.S. capacity can absorb overflow, back-end processing, and non-interactive workloads when coastal power or lead time becomes the constraint.
Before signing anything, ask for these proof points:
- A utility-backed energization timeline, not just total designed megawatts.
- Facility-level carrier and exchange reach, checked against PeeringDB and validated with live test traces.
- Measured latency from the ASNs that matter, not generic nearby-region ping tests.
- Cooling and water disclosures, including PUE, cooling architecture, recycled-water use where applicable, and public benchmarking data.
- A deployment-speed plan that identifies the pre-production steps still on your side before launch.
Two inputs should still be revalidated at deal time: facility-level cross-connect pricing and live utility energization dates for the specific building or campus. The latency floors above are illustrative physics estimates, not provider-specific production benchmarks; real routing policy, congestion, and carrier choice can move observed latency materially higher.
Build Low-Risk Latency Capacity
California data centers should not be selected by map distance alone. The practical route is to measure user latency, confirm energized power, verify facility-level interconnection, and test sustainability exposure before committing nodes. Dedicated servers are the faster choice when the deployment schedule is tighter than the hardware supply chain.
For teams building California and West Coast capacity, the question is not whether California is attractive. It is whether the first deployment can stay fast without trapping future growth in a power- or cross-connect-limited site. That is where Melbicom’s Los Angeles footprint becomes a practical starting point, not a generic regional claim.
Deploy in Los Angeles
Launch dedicated server capacity close to West Coast users without waiting on colocation timelines.