
Blog
CDN Pricing Explained: What Determines Your Total Delivery Cost?
The cheapest-looking CDN quote isn't necessarily the cheapest CDN.
A $0.02/GB rate tells you only a part of the final invoice story when users span multiple pricing regions, applications generate billions of requests, or commitments and optional services introduce additional charges.
For CDN buyers, the question isn't what a gigabyte costs. It's what delivering your workload will cost across ordinary months, traffic spikes, and geographic markets.
Plan Your CDN Costs– No per-request fees – Premium and Volume CDN – Raw logs and analytics |

|
What Determines Total CDN Cost?
Total content delivery network cost depends on delivered traffic, geographic pricing, request volume, minimum commitments, overages, and optional services. The most useful comparison is effective cost per delivered terabyte, calculated from the complete monthly invoice rather than the advertised bandwidth rate. Buyers should evaluate both expected consumption and peak-month scenarios.
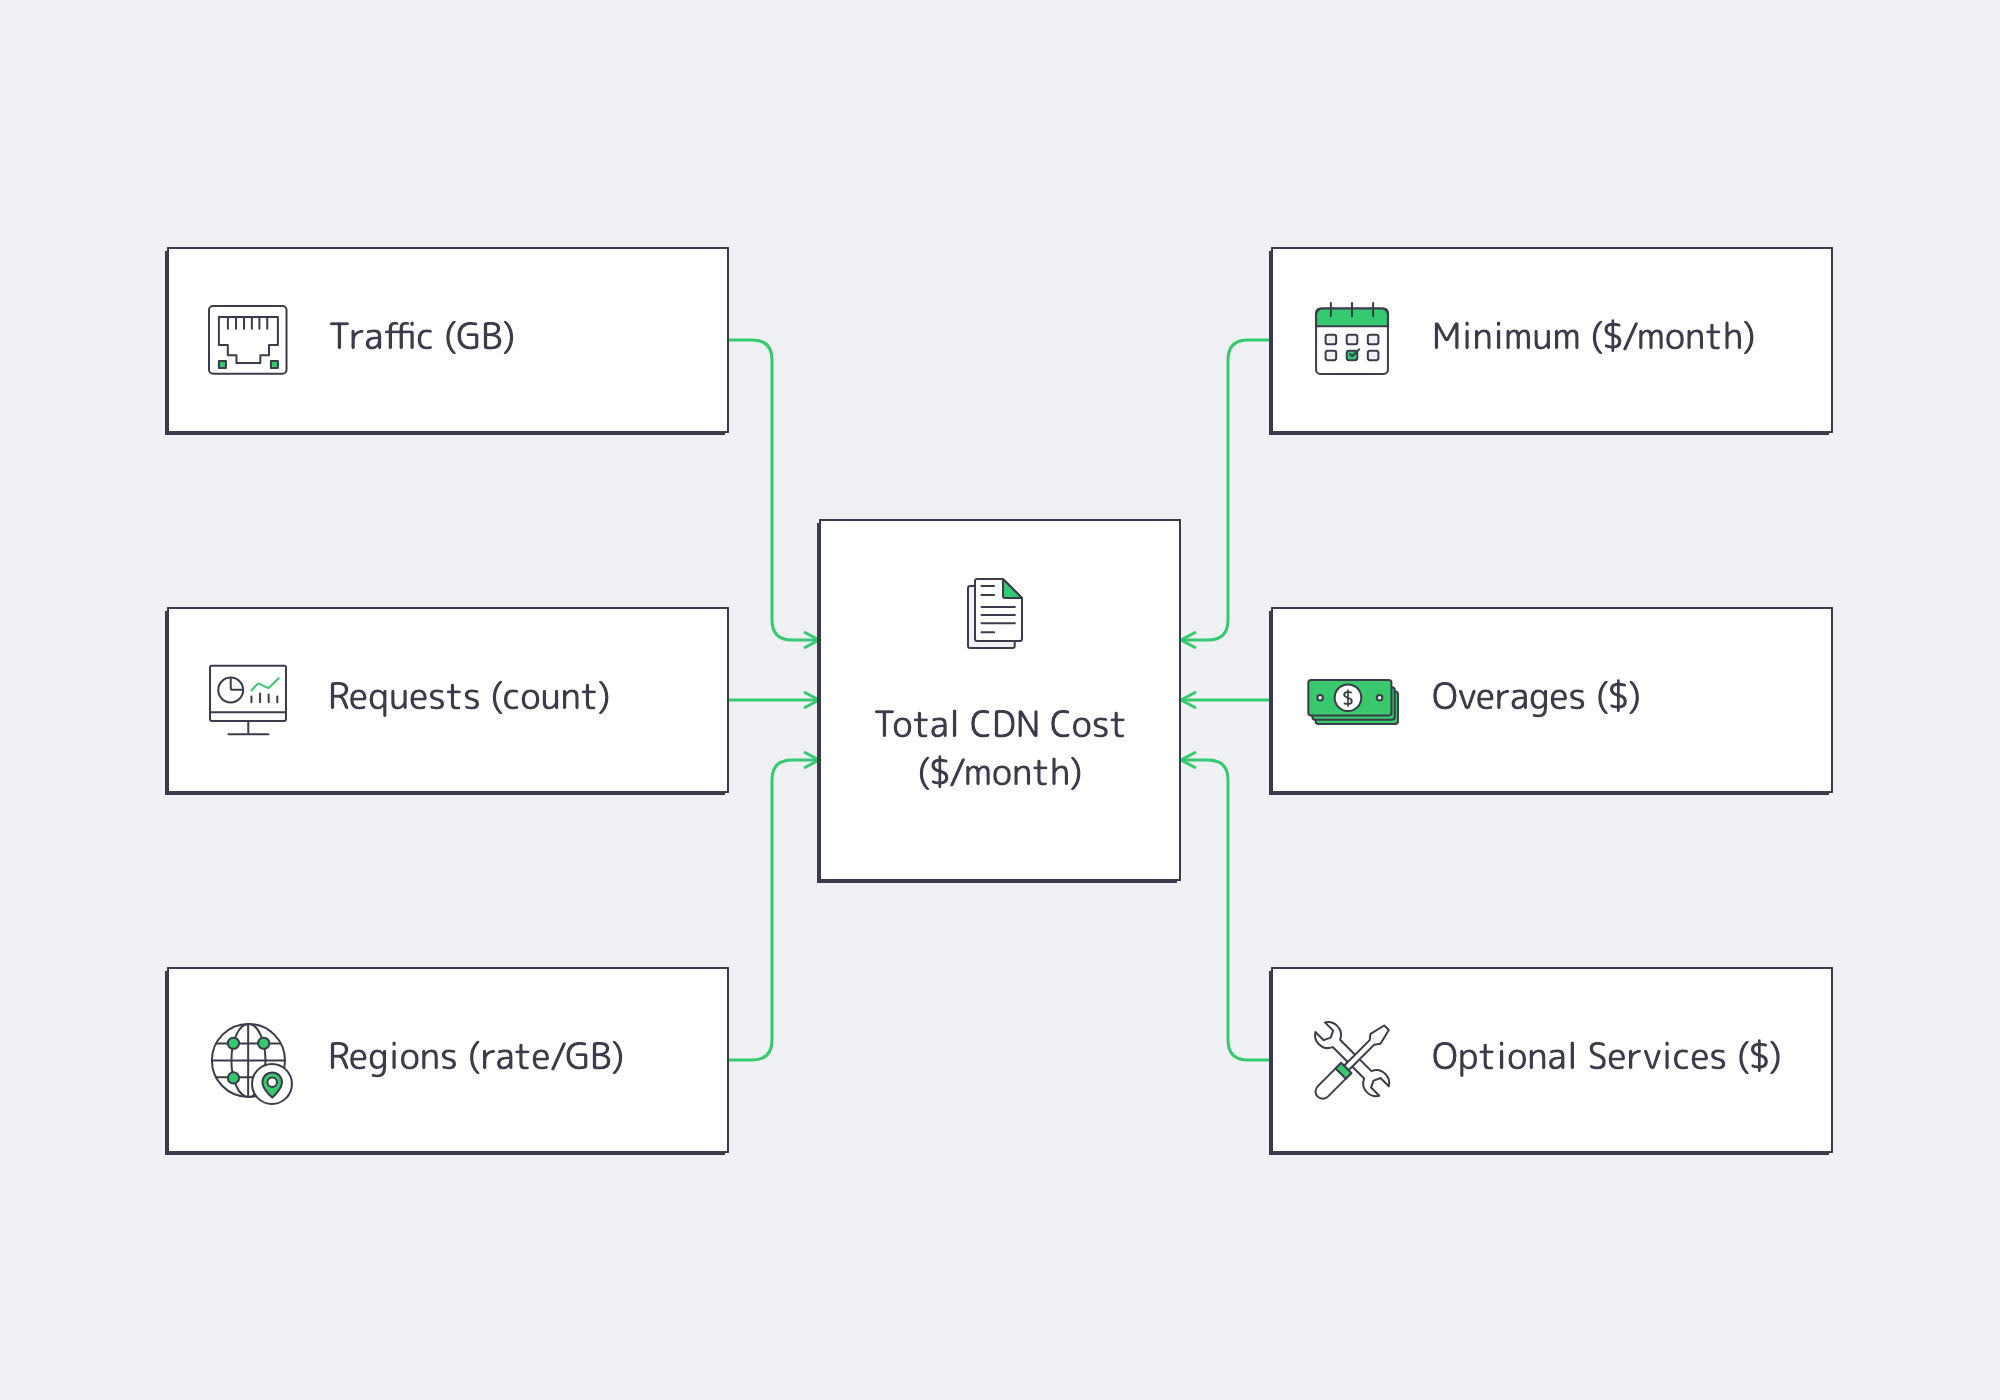
Two basic formulas capture the distinction:
PAYG CDN cost = regional delivery charges + request charges + separately metered services
Committed CDN cost = monthly commitment + overage + non-included request charges + non-included services
Unused commitments create an additional economic cost, even when they don't appear as separate invoice items.
Published CDN pricing schedules illustrate the complexity: cache delivery can range from $0.02 to $0.20/GiB, with additional charges of $0.0075 per 10,000 cache-look-up requests and separate cache-fill fees.
Normalize Units Before Comparing CDN Costs
Even the definition of a gigabyte matters. According to NIST, one GB contains 1 billion bytes, while one GiB contains 1,073,741,824 bytes—a 7.37% difference.
Normalize quotes to a consistent unit:
1 TB = 1,000 GB
Check whether billed traffic includes response headers, cache fills, or other transfers.
Request density matters. At $0.0075 per 10,000 requests, delivering roughly 105,000 responses averaging 10 KiB adds approximately $0.079/GiB in request charges alone. With 1 MiB objects, that request charge falls below one-tenth of a cent per GiB.
Track both metrics:
Effective CDN cost per TB = total monthly CDN charges ÷ delivered TB
Effective CDN cost per million requests = total monthly CDN charges ÷ monthly requests in millions
The FinOps Foundation's Unit Economics framework recommends connecting technology spending to measurable consumption units rather than relying on aggregate invoices.
How Geography Changes CDN Cost
Two applications delivering identical traffic volumes can have dramatically different invoices because their audiences occupy different billing regions.
Calculate geographic pricing using:
Blended delivery rate = Σ (regional traffic share × regional rate)
Assume hypothetical regional prices of $0.025, $0.075, and $0.150/GB.
An 80% / 15% / 5% distribution produces:
(0.80 × $0.025) + (0.15 × $0.075) + (0.05 × $0.150) = $0.03875/GB
A 30% / 30% / 40% distribution produces:
$0.090/GB
The second workload costs more than twice as much per delivered gigabyte under the same rate card.
Export traffic by destination country and map it to each commercial offer's billing regions. Network coverage also matters: a cheaper geographic footprint isn't necessarily economical if it fails to serve important audiences effectively.
CDN Costs by Workload and Region
Monthly CDN costs vary substantially between workloads because bandwidth, request density, and geographic distribution interact differently. A 60 TB application generating five billion requests can cost more than expected, while a 400 TB video library may be dominated by bandwidth charges. Comparing realistic workload profiles reveals which pricing structure offers better economics.

One CDN Rate Can Produce Very Different Invoices
Consider two entirely hypothetical offers.
Usage Offer: Region A costs $0.025/GB, B costs $0.075/GB, and C costs $0.150/GB. Requests cost $0.005 per 10,000, logs cost $0.20 per million requests, and there is no minimum.
Commit Offer: An $8,000 monthly minimum includes 300,000 weighted GB. Regions A, B, and C count at 1×, 3×, and 6×, respectively. Requests and logs are included; overages cost $0.020 per weighted GB.
Assumed geographic distributions are 70/20/10 for SaaS, 30/30/40 for the request-heavy application, 50/30/20 for video, and 80/15/5 for software distribution.
| Hypothetical Workload | Delivery/Month | Requests/Month | Usage Offer | Commit Offer |
|---|---|---|---|---|
| Static SaaS / commerce | 25 TB | 500M | $1,538 | $8,000 |
| Request-heavy application | 60 TB | 5.0B | $8,900 | $8,000 |
| Video library | 400 TB | 80M | $26,056 | $22,800 |
| Software / game distribution | 900 TB | 12M | $34,883 | $29,900 |
The 25 TB SaaS workload illustrates commitment waste: its usage-based bill is approximately one-fifth of the minimum.
The 60 TB application reveals request economics. Five billion requests add $3,500 in request and logging charges to a $5,400 bandwidth bill.
For the 400 TB video workload, average responses are approximately 5 MB. Bandwidth and geographic weighting dominate.
Software distribution averages approximately 75 MB per request. Request charges become negligible compared with delivery volume and commitment utilization.
No single profile identifies the universally cheaper commercial structure. Model soft, expected, and peak months, preserving the same geographic demand across offers. Where demand fluctuates significantly, P50 and P90 traffic forecasts support comparisons.
Which CDN Plan Limits and Extra Charges Should Buyers Check?
CDN buyers should verify monthly minimums, eligible traffic, unused commitment rules, overage rates, geographic restrictions, request billing, and optional service charges. A discounted commitment becomes uneconomical when utilization falls below its break-even threshold. Logging, security processing, origin shielding, and other features must also be priced consistently across commercial proposals.
Minimum Commitments and Overages
A minimum payment may not include a traffic allowance. Some contracts provide consumption credits; others guarantee monthly spending without equivalent usage.
If PAYG costs $1 per unit and a commitment costs $0.80, at 80% utilization:
$0.80 ÷ 80% utilization = $1.00 effective cost per consumed unit
The discount disappears.
Break-even commitment utilization ≈ committed unit rate ÷ PAYG unit rate
A 30% discount therefore requires approximately 70% utilization to break even, assuming comparable usage and no additional charges.
Track commitment terms and remaining allowances separately from consumption so unused capacity and overage exposure are visible before renewal.
Overages require equally careful modeling:
Committed-plan effective rate = (minimum + overage charges + extras) ÷ actual delivered traffic
Verify whether allowances are global or regional, whether unused capacity carries forward, and whether volume discounts apply incrementally or retroactively.
Optional Services Can Change the Economics
A CDN quote should distinguish included capabilities from separately billed services.
Potential charges include request processing, logging, cache storage, origin shielding, security processing, image transformations, and edge execution.
Logging can scale with request volume rather than bandwidth. Usage-based log pricing documentation illustrates why buyers should estimate export volume before deployment.
Origin shielding presents a different tradeoff: an additional request charge may reduce duplicate origin fetches and processing. Origin-shield documentation describes how consolidating cache misses can reduce origin load.
Compare incremental feature costs against the resources or operational work they replace. Keep detailed cloud-origin egress calculations separate, while recording whether cache-fill and origin-transfer charges are included.
Compare Content Delivery Network Cost
A defensible purchasing decision requires one normalized comparison model covering actual consumption, contractual conditions, and required functionality.
Select representative billing periods that capture ordinary demand, a quieter period, and a traffic spike or launch. Separate bandwidth-heavy applications from request-heavy workloads, then map destination countries into the pricing regions defined by each offer.
Calculate request density:
Requests per GB = monthly requests ÷ monthly delivered GB
Next, document commitments, overages, eligible usage, currency, billing units, and the treatment of unused allowances. Model low, expected, and peak months without changing the underlying audience distribution.
Required functionality should be identical across evaluations. For example, Melbicom's CDN offering supports raw logs and real-time analytics, which can help teams examine delivery usage and request patterns when building their cost models. Buyers should define required capabilities and their commercial treatment before comparing totals.
The final decision sheet should cover:
- Normalize usage: Match GB/GiB, currencies, billing periods, and request units.
- Model geography: Apply destination-country traffic to regional rates.
- Measure request density: Separate small-object and bandwidth-heavy workloads.
- Stress-test commitments: Compare low, expected, and peak consumption against minimums and overages.
- Calculate fully loaded costs: Include required services and compare monthly spend, cost per TB, and business-relevant unit economics.
Look Beyond the Headline CDN Rate
Content delivery network cost is a function of workload behavior and contract structure, not simply the advertised bandwidth rate. Geography can double blended delivery costs, request charges can transform small-object economics, and unused commitments can eliminate negotiated discounts.
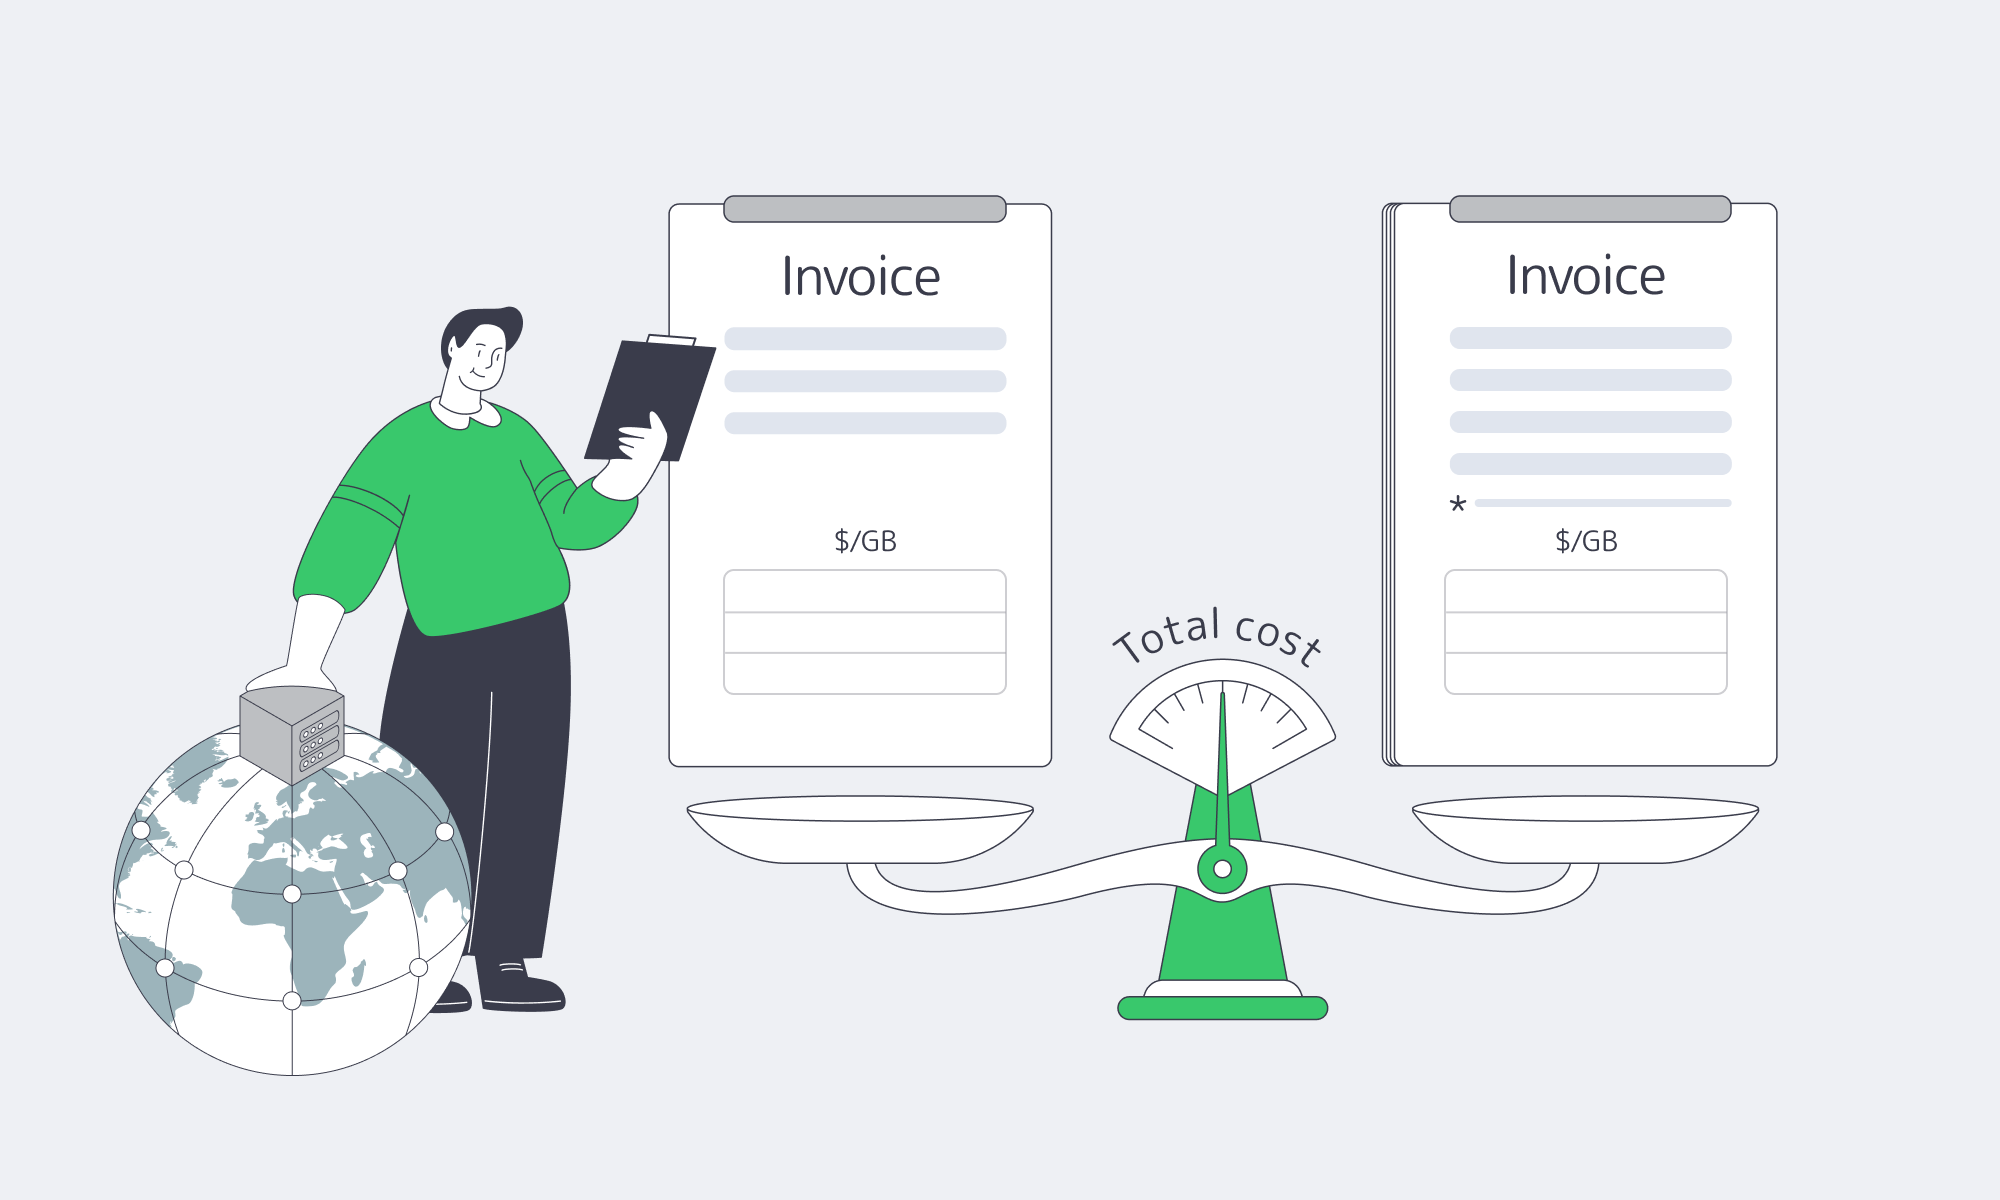
The strongest commercial choice remains competitive across realistic demand scenarios while meeting the application's delivery requirements. That means evaluating the complete invoice alongside network coverage and the services engineering actually needs.
Evaluate Melbicom CDN
Compare our Premium and Volume CDN options against your traffic mix and delivery needs. Bandwidth-based pricing without per-request fees simplifies forecasting for request-heavy workloads.